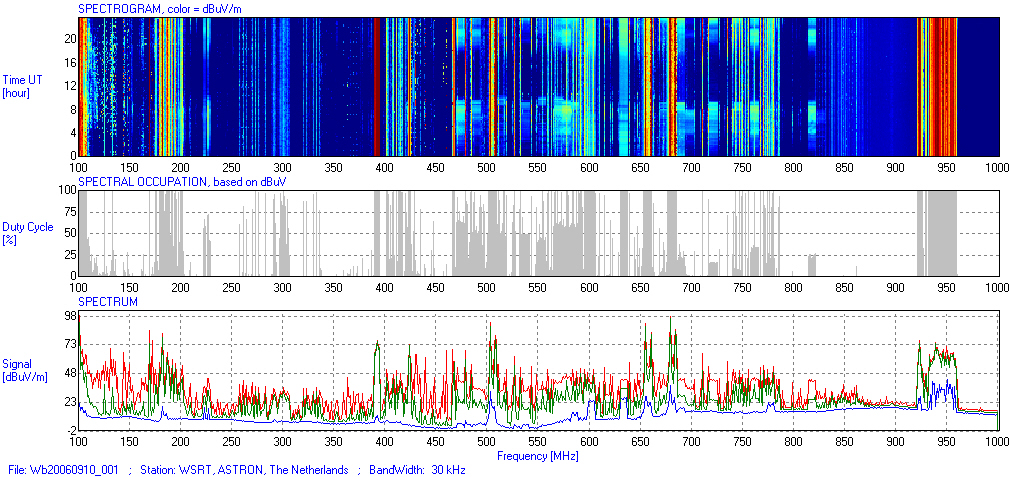
| Description: | The image shows a view of the radio spectrum, as measured by the RFI monitoring system at the WSRT. The spectrum has undergone significant changes in recent months. The advent of digital television and radio is causing this remarkable change. The digital tv bands can be recognized by their broad square appearance in the top spectrogram, which runs from 100 MHz to 1000 MHz on the horizontal scale, and with 24 hours in time along the vertical axis. Superimposed on top of the digital TV bands, a trained eye will see the old analog TV signals; these signals will be switched off by the end of this year, causing yet another (welcome) change to the noisy spectrum that radiotelescopes such as the WSRT have to live with.
The middle panel shows percentage occupancy in the spectrum and the bottom panel the minimum, average and maximum signal levels. Propagation differences during the day/night stand out in the digital broadcast bands. |