Daily Image
29-11-2006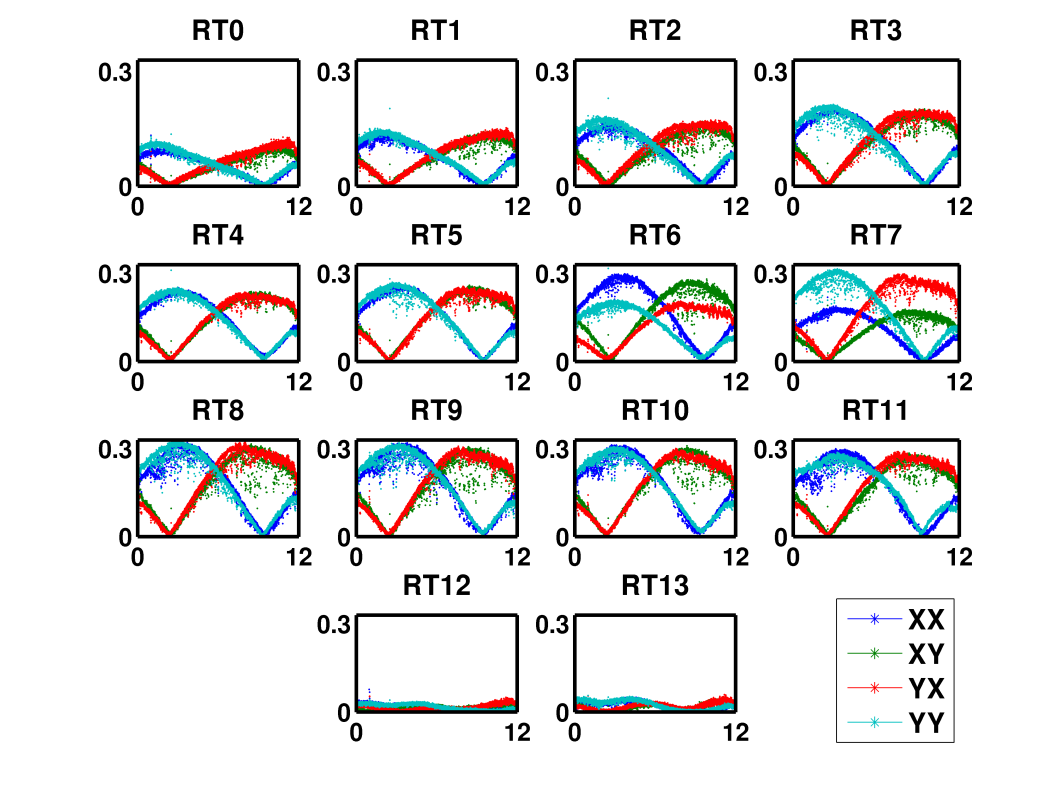
Krakelingen-2
| Submitter: | Sarod Yatawatta |
| Description: | The above figure shows the visibility amplitudes of the new Westerbork High-band Antenna Test-station (WHAT-2) for LOFAR. Each of the 14 figures correspond to the baselines formed with the 14 Westerbork telescopes. The field observed was Cassiopeia-A. The observing frequency was 155.75 MHz with 5kHz bandwidth. In comparison with the old WHAT tile, we see better symmetry and an improvement in the signal to noise ratio. The WHAT is located near WSRT telescope RT8. Since the source is resolved for the longer baselines, the amplitude is smallest for the baselines with RT0, RT12 (RTC) and RT13 (RTD). The sinusoidal amplitude variations are caused by the fact that the angles between the stationary WHAT dipoles and the WSRT dipoles change while the source is tracked across the sky. The angles are identical (45 degr) for all four correlations (XX,XY,YX,YY) when the source transits the meridian, i.e. they should intersect in the centre of each plot. This is the case for all baselines, except for the ones with RT6 and RT7, which is caused by dipole connector problems. Ideally, all four tracks should be symmetric around transit. |
| Copyright: | WHAT X Team |
| Tweet |  |