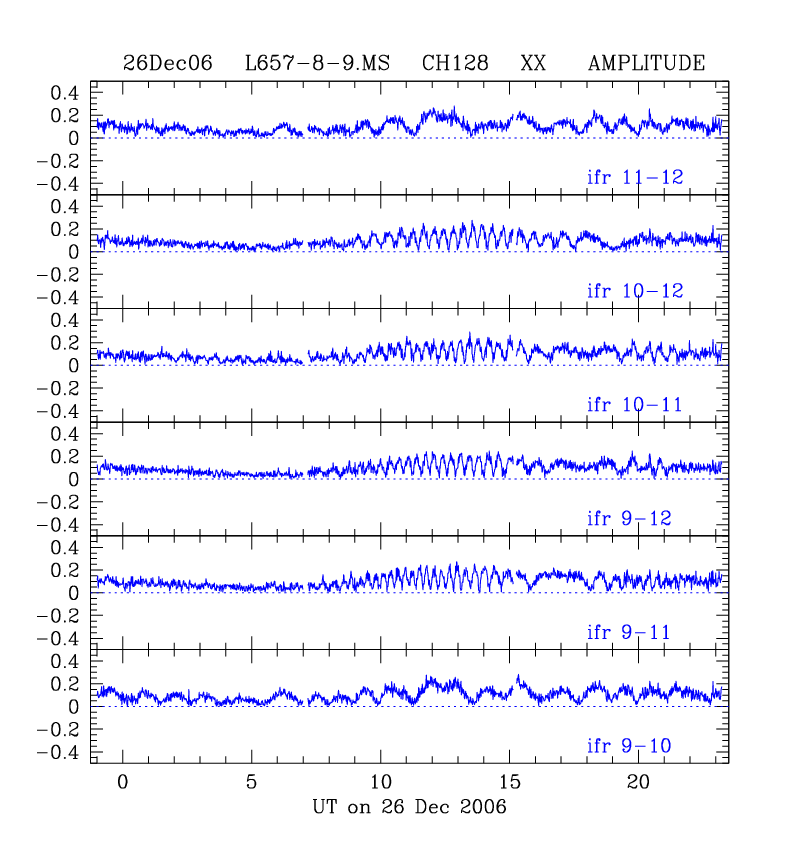
| Description: | The plot shows the visibility amplitude as a function of time for all 6 baselines formed between the 4 LBA dipoles in LOFAR station CS8. The signals refer to one 0.6 kHz channel centered at 60 MHz and for one polarization. The data were taken on December 26, 2006. Baseline lengths vary between about 30 and 120 meters and two of them are redundant.
We think the following interpretation explains what we see: In the first 8 hours of the observation the visibility is dominated by CasA, which results in a fairly constant amplitude which slowly decreases when CasA moves towards the northern horizon. Thereafter, CygA rises in elevation and starts to rival CasA in strength. This results in the nice beat pattern that develops after UT 10h on the longer baselines where the Galaxy becomes resolved. |