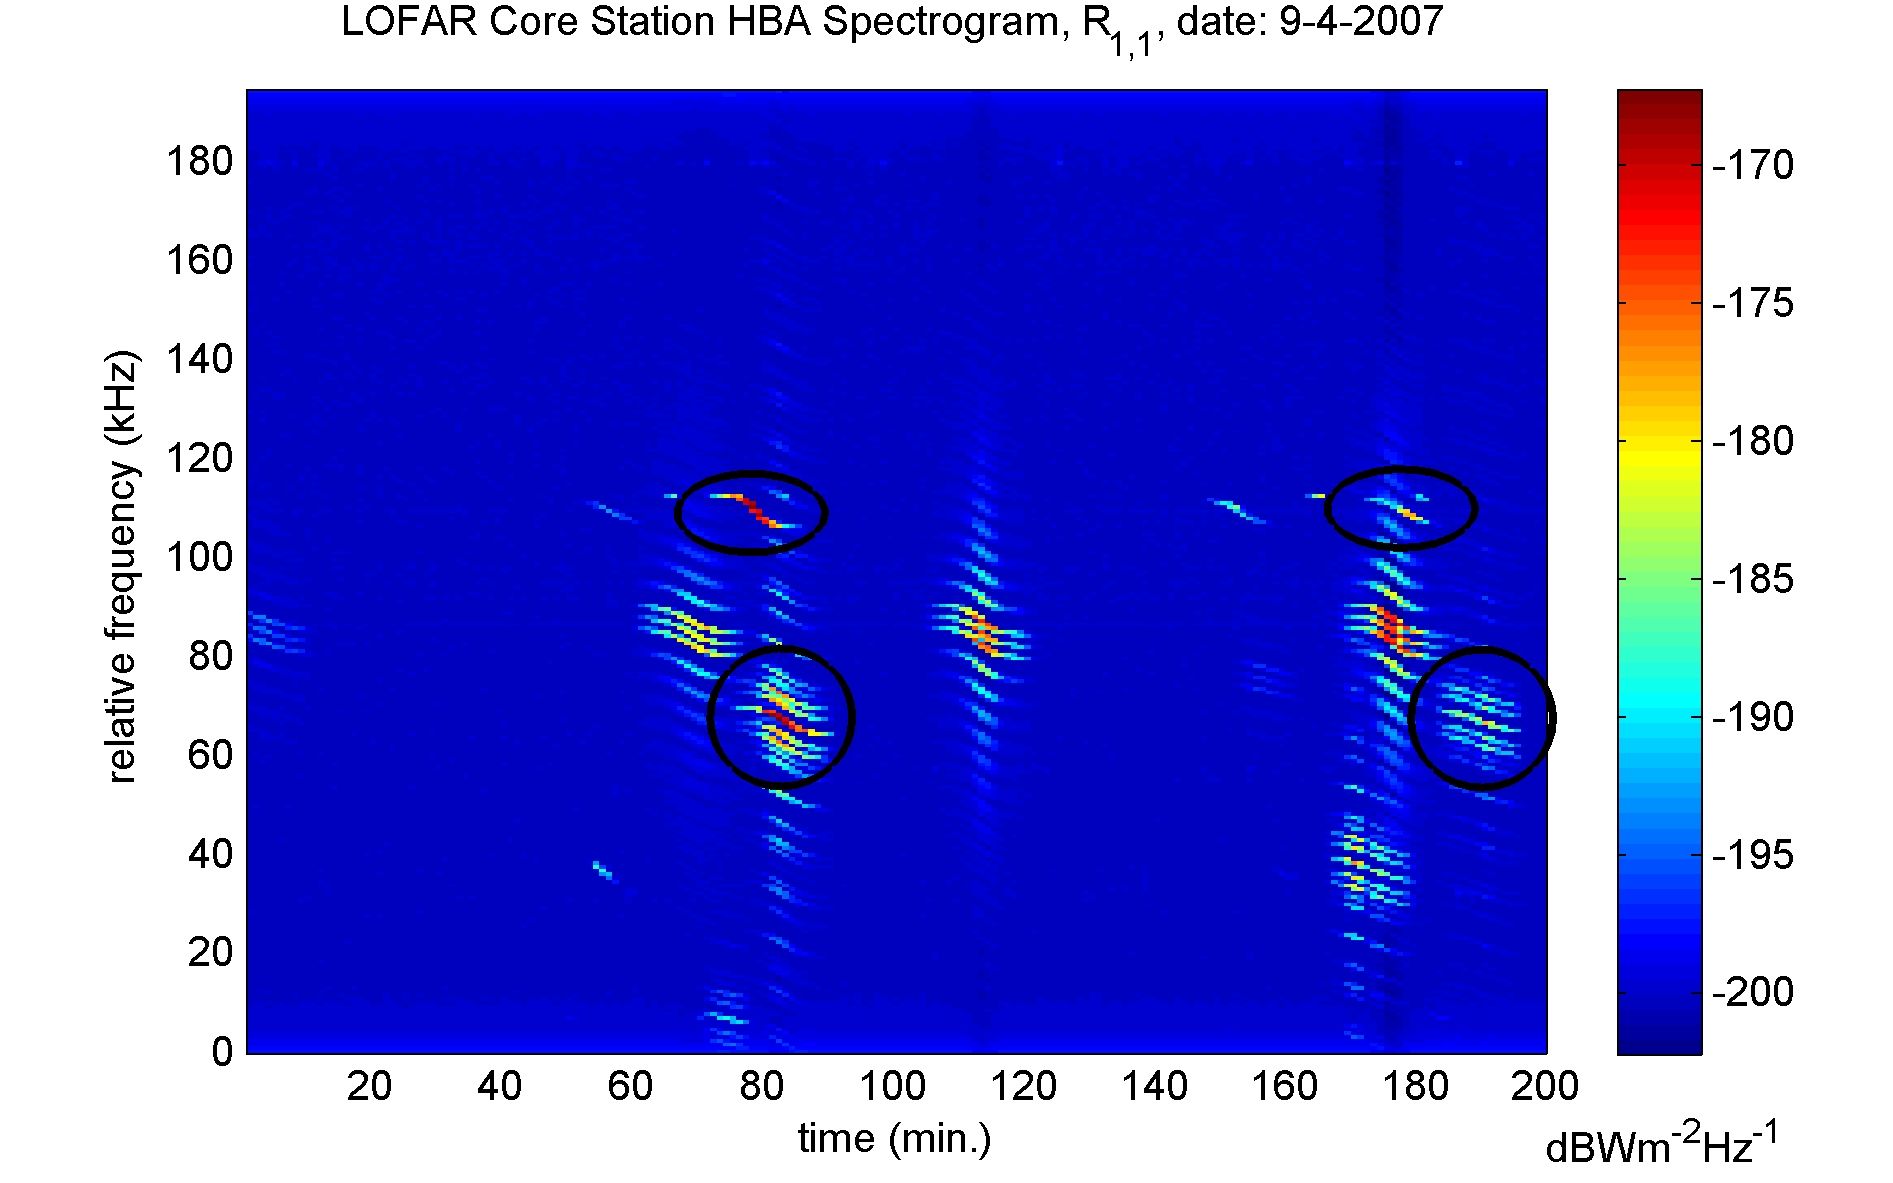
| Description: | The figure shows a time-frequency autocorrelation spectrogram of a single HBA antenna dipole in the LOFAR HBA-low band (110-190 MHz). At least four different satellites can be seen in the figure. The upper left ellipse marks an s-shaped curve, which corresponds to an 8 kHz doppler shifted signal during the transit of the satellite. About 97 minutes later, the satellite is visible again, indicated by the upper right ellipse. This period indicates that the satellite orbits at an altitude of about 650 km. Note that for this second transition the doppler shift has decreased to 6 kHz, apparently because the satellite does not pass close to the zenith, but much lower to the horizon. This leads to a lower relative velocity and as a consequence to a lower doppler shift. A second satellite, having a slightly longer orbital period, is indicated by the circles. This satellite has spectral sidelobes, which are also doppler shifted. Orbital parameters, either obtained from satellite databases or derived from LOFAR data, can be used to predict the occurrence of such satellite signals. This information is relevant for minimizing the effects of satellite signals on LOFAR measurements by careful scheduling, flagging, and spatial filtering. This spectrogram was obtained by processing LOFAR measurement sets (MS) by Matlab after converting LOFAR CEP MS data to Matlab *.mat files. The conversion was done by a stand-alone C++ program running under Linux written by Harmen Jeurink.
|