Daily Image
12-03-2008
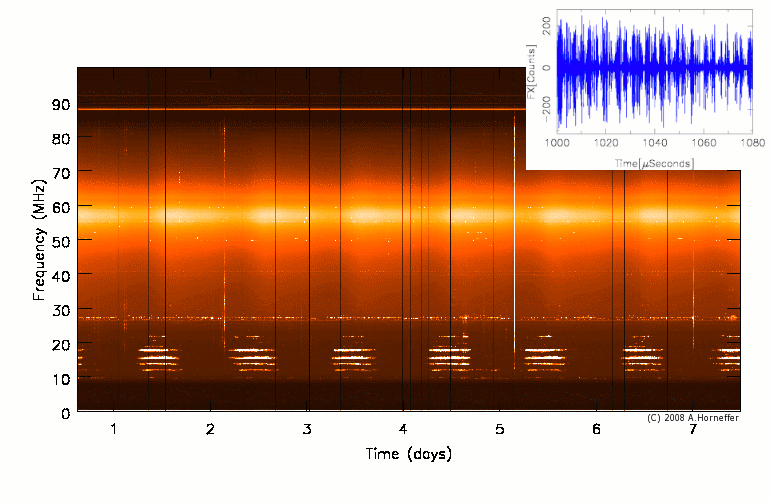
One week of TBB data.
| Submitter: | Andreas Horneffer |
| Description: | The image shows a dynamic spectrum generated from low band antenna data taken with the TBBs. Over the course of a week every five minutes a dataset of 10 milliseconds was taken.
The dark vertical stripes occur when the prototype readout software generated noncontinuous datasets. Bright vertical stripes are caused by strong RFI. A closer look reveals that this RFI takes the shape of trains of short pulses (see inset.) Fortunately such RFI pulses are rare during quiet times. |
| Copyright: | The LOFAR CR Team |
Please feel free to submit an image using the
Submit page.