Daily Image
14-03-2012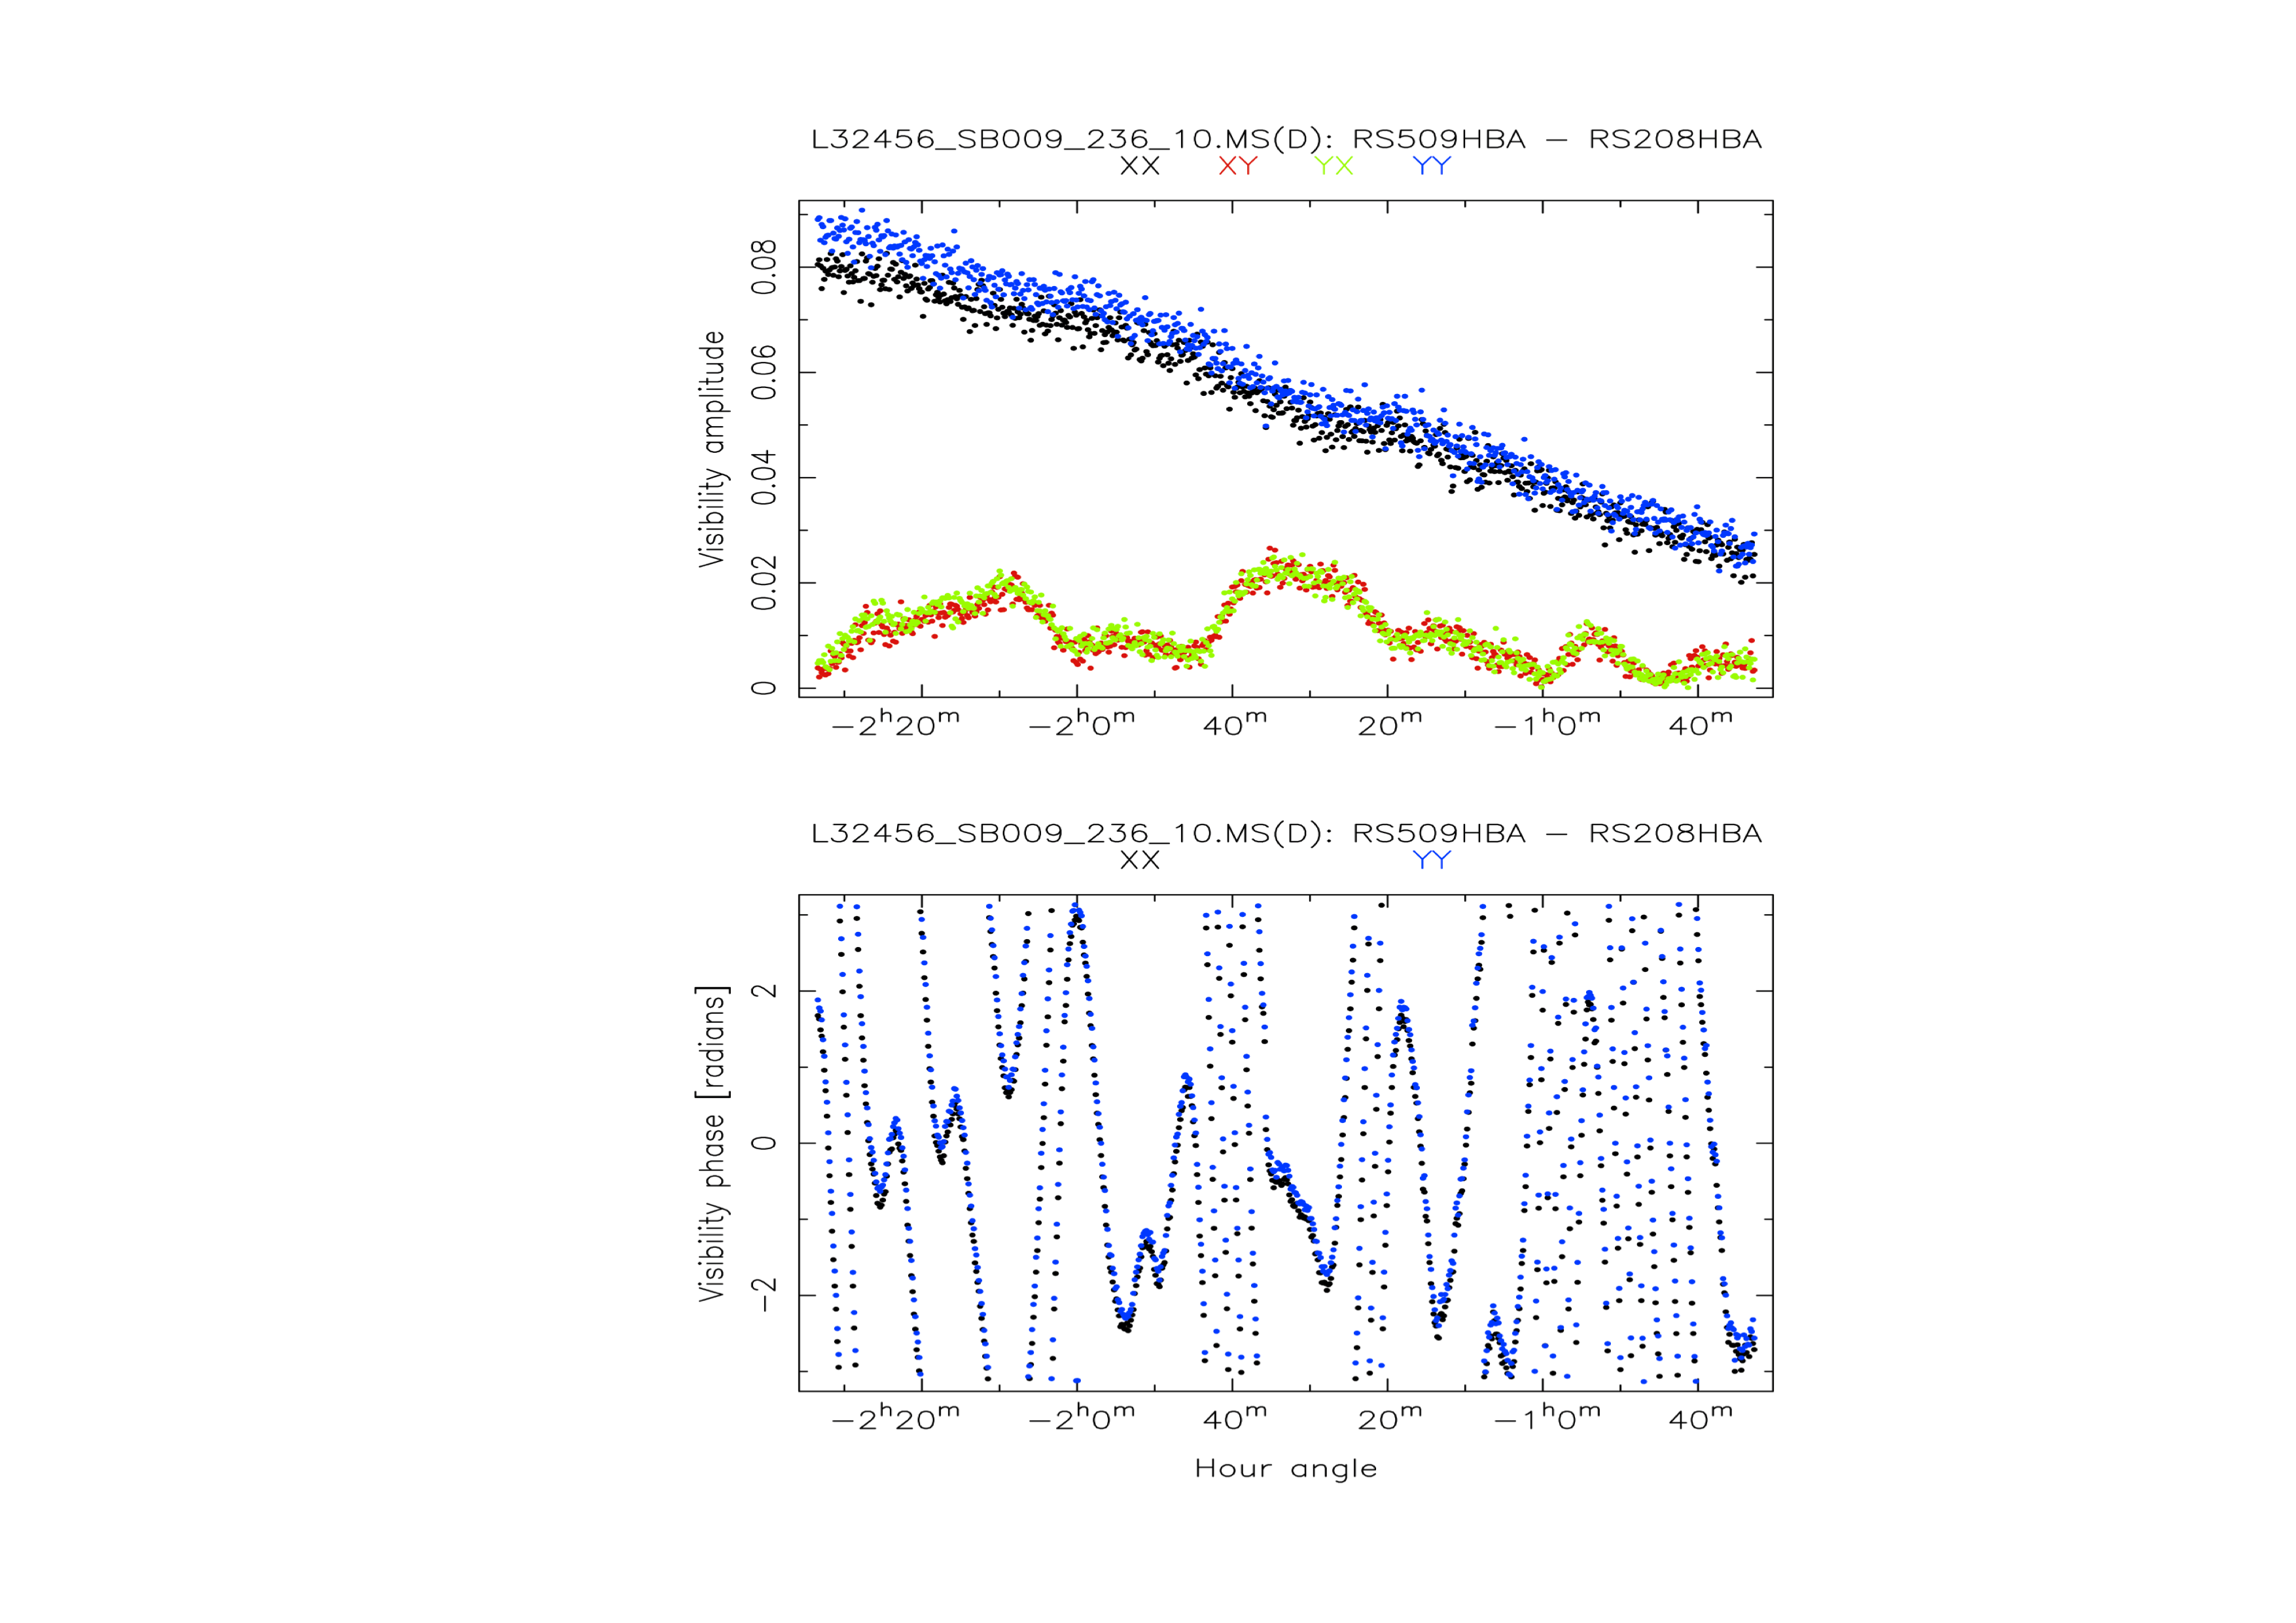
Differential Faraday rotation at LOFAR
| Submitter: | Ger de Bruyn |
| Description: | From the start of LOFAR it has been known that the ionosphere would create interesting challenges for both calibration and imaging. The ionosphere is a thick 'blanket' of plasma, electrons and ions created by the ionizing radiation from the Sun, extending from 100 to 1000 km above the surface of the Earth. The ionospheric electron density varies with time, location and height. LOFAR is sensitive to both large and small scale structure in the ionosphere. The two graphs shown above reveal the effect of the ionosphere in two different ways. The top graph show the visibility amplitude of the source 3C295 on a baseline of about 80 km between stations RS509 (near Roodeschool) and RS208 (near Coevorden).The four colours represent the amplitude on the four cross correlations between the orthogonal dipoles (XX-black, YY-blue, XY-red, YX-green). The source 3C295 is resolved on this baseline causing its amplitude (XX, YY) to drop when it approaches meridian transit. However, the source is also intrinsically unpolarized so there should be NO signal in the XY and YX correlations. We do see, however, a very significant signal. This is caused by Differential Faraday Rotation (DFR) due to the ionosphere over the two stations. (Faraday rotation leads to a change in the direction of vibration of the electromagnetic wave). This DFR is also time variable on timescales of 5-10 minutes. The bottom graph show the phase (XX and YY only) for the same baseline and time. Note how the periods of rapid changes in the DFR (i.e. in the XY and YX signals) correlate perfectly with the times that the visibility phase winds very rapidly; this is called the Differential Phase Delay (DPD). Both the DFR and DPD are proportional to the difference between the Total Electron Content (TEC) along the sightlines to the source from these two stations. At the frequency of 117 MHz the observed ratio depends only on the Earth magnetic field. The combination of the phase-rates and variable 'quasi-polarized' signals, which also changes with frequency, over the LOFAR array, is a great diagnostic tool to study and characterize small scale (10-20 km) structures in the ionosphere. A method to solve for the DFR has been developed by Sarod Yatawatta (2012, Experimental Astronomy, in press). The data were taken in October 2011, around noon. |
| Copyright: | Ger de Bruyn |
| Tweet |  |