Daily Image
20-02-2013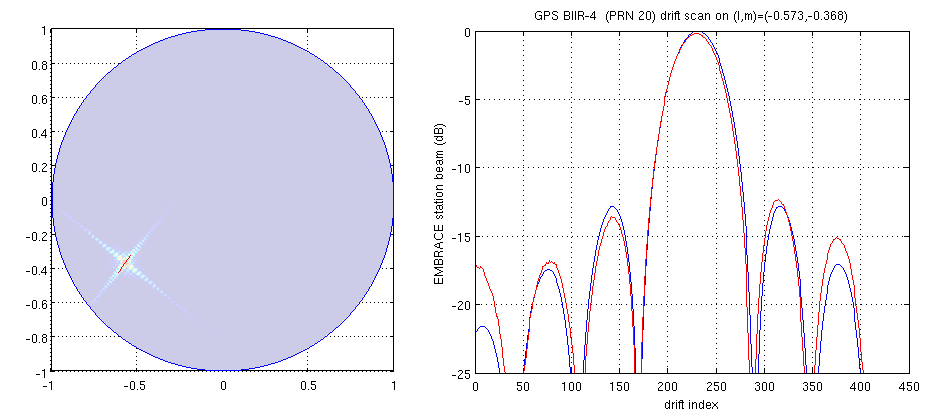
Beam Verification of EMBRACE
| Submitter: | Dion Kant |
| Description: | To verify a cross cut of the EMBRACE station beam a GPS satellite has been used as a source which drifts through the beam. This is shown by the red track in the left (lmn) plot. The right plot shows in blue the station beam as predicted by the array factor model and in red the measurement result of the GPS satellite. It seems that the EMBRACE station beam can be modeled accurately with the array factor model (note the logarithmic scale on the vertical axis). Also the position of the nulls agree with this model. The used GPS satellite frequency for this plot is 1227.60 MHz. Other satellite frequencies can be used as well to verify the EMBRACE station beam, resulting in a station beam versus frequency plot. As we would also like to demonstrate station beam versus scan angle, we will make cross cuts of other GPS trajectories as well. Next step is to repeat these measurements on broadband radio sources, taking in account the limited sensitivity of EMBRACE. Currently the EMBRACE station in Westerbork consists of 98 tiles and spans an area of ~110 m^2. The number of antenna elements is ~14000. |
| Copyright: | EMBRACE |
| Tweet |  |