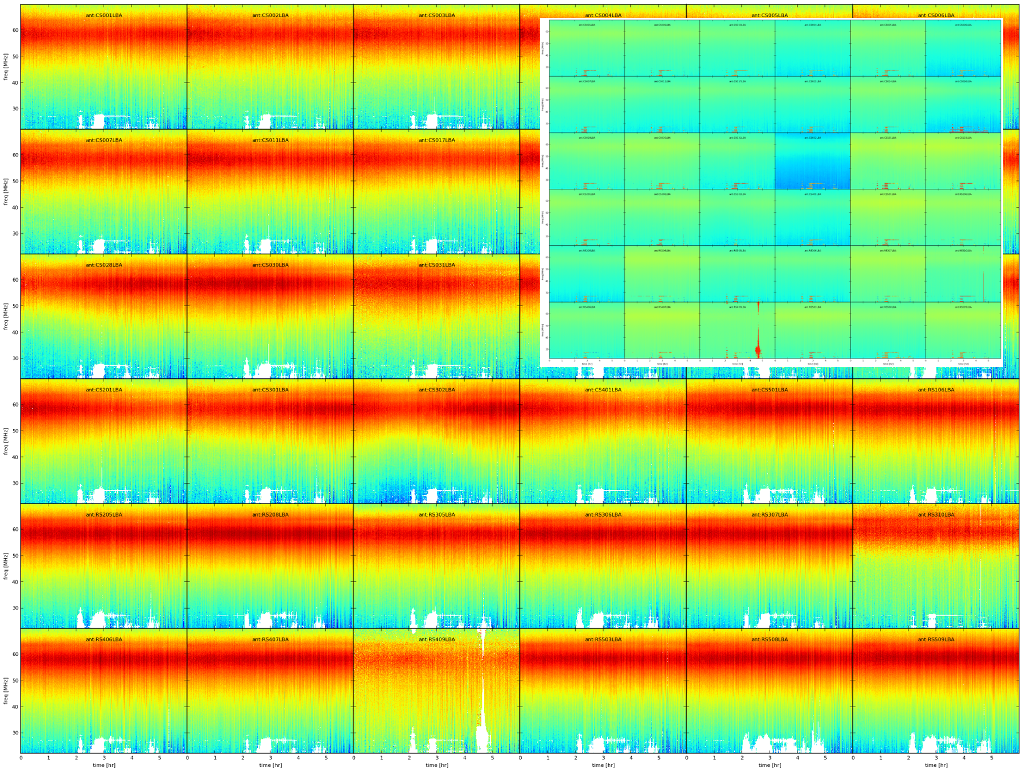
| Description: | LOFAR-LBA amplitude solutions on 3C196 of a 6h observation plotted using LoSoTo (the LOFAR Solution Tool). Every panel is one station, on the X axis the observing time in hours, on the Y axis the observing frequency in MHz (22-70 MHz). The bandpass effect is dominant and underline the strong peak of LBA bandpass at 58 MHz. The small panel shows unflagged data with many outliers that were identified and flagged with LoSoTo. Good amplitude solutions obtained using a good model (such as in this case) should be relatively constant in time. This is not the case for phases (see daily image of last week). |