Daily Image
14-10-2015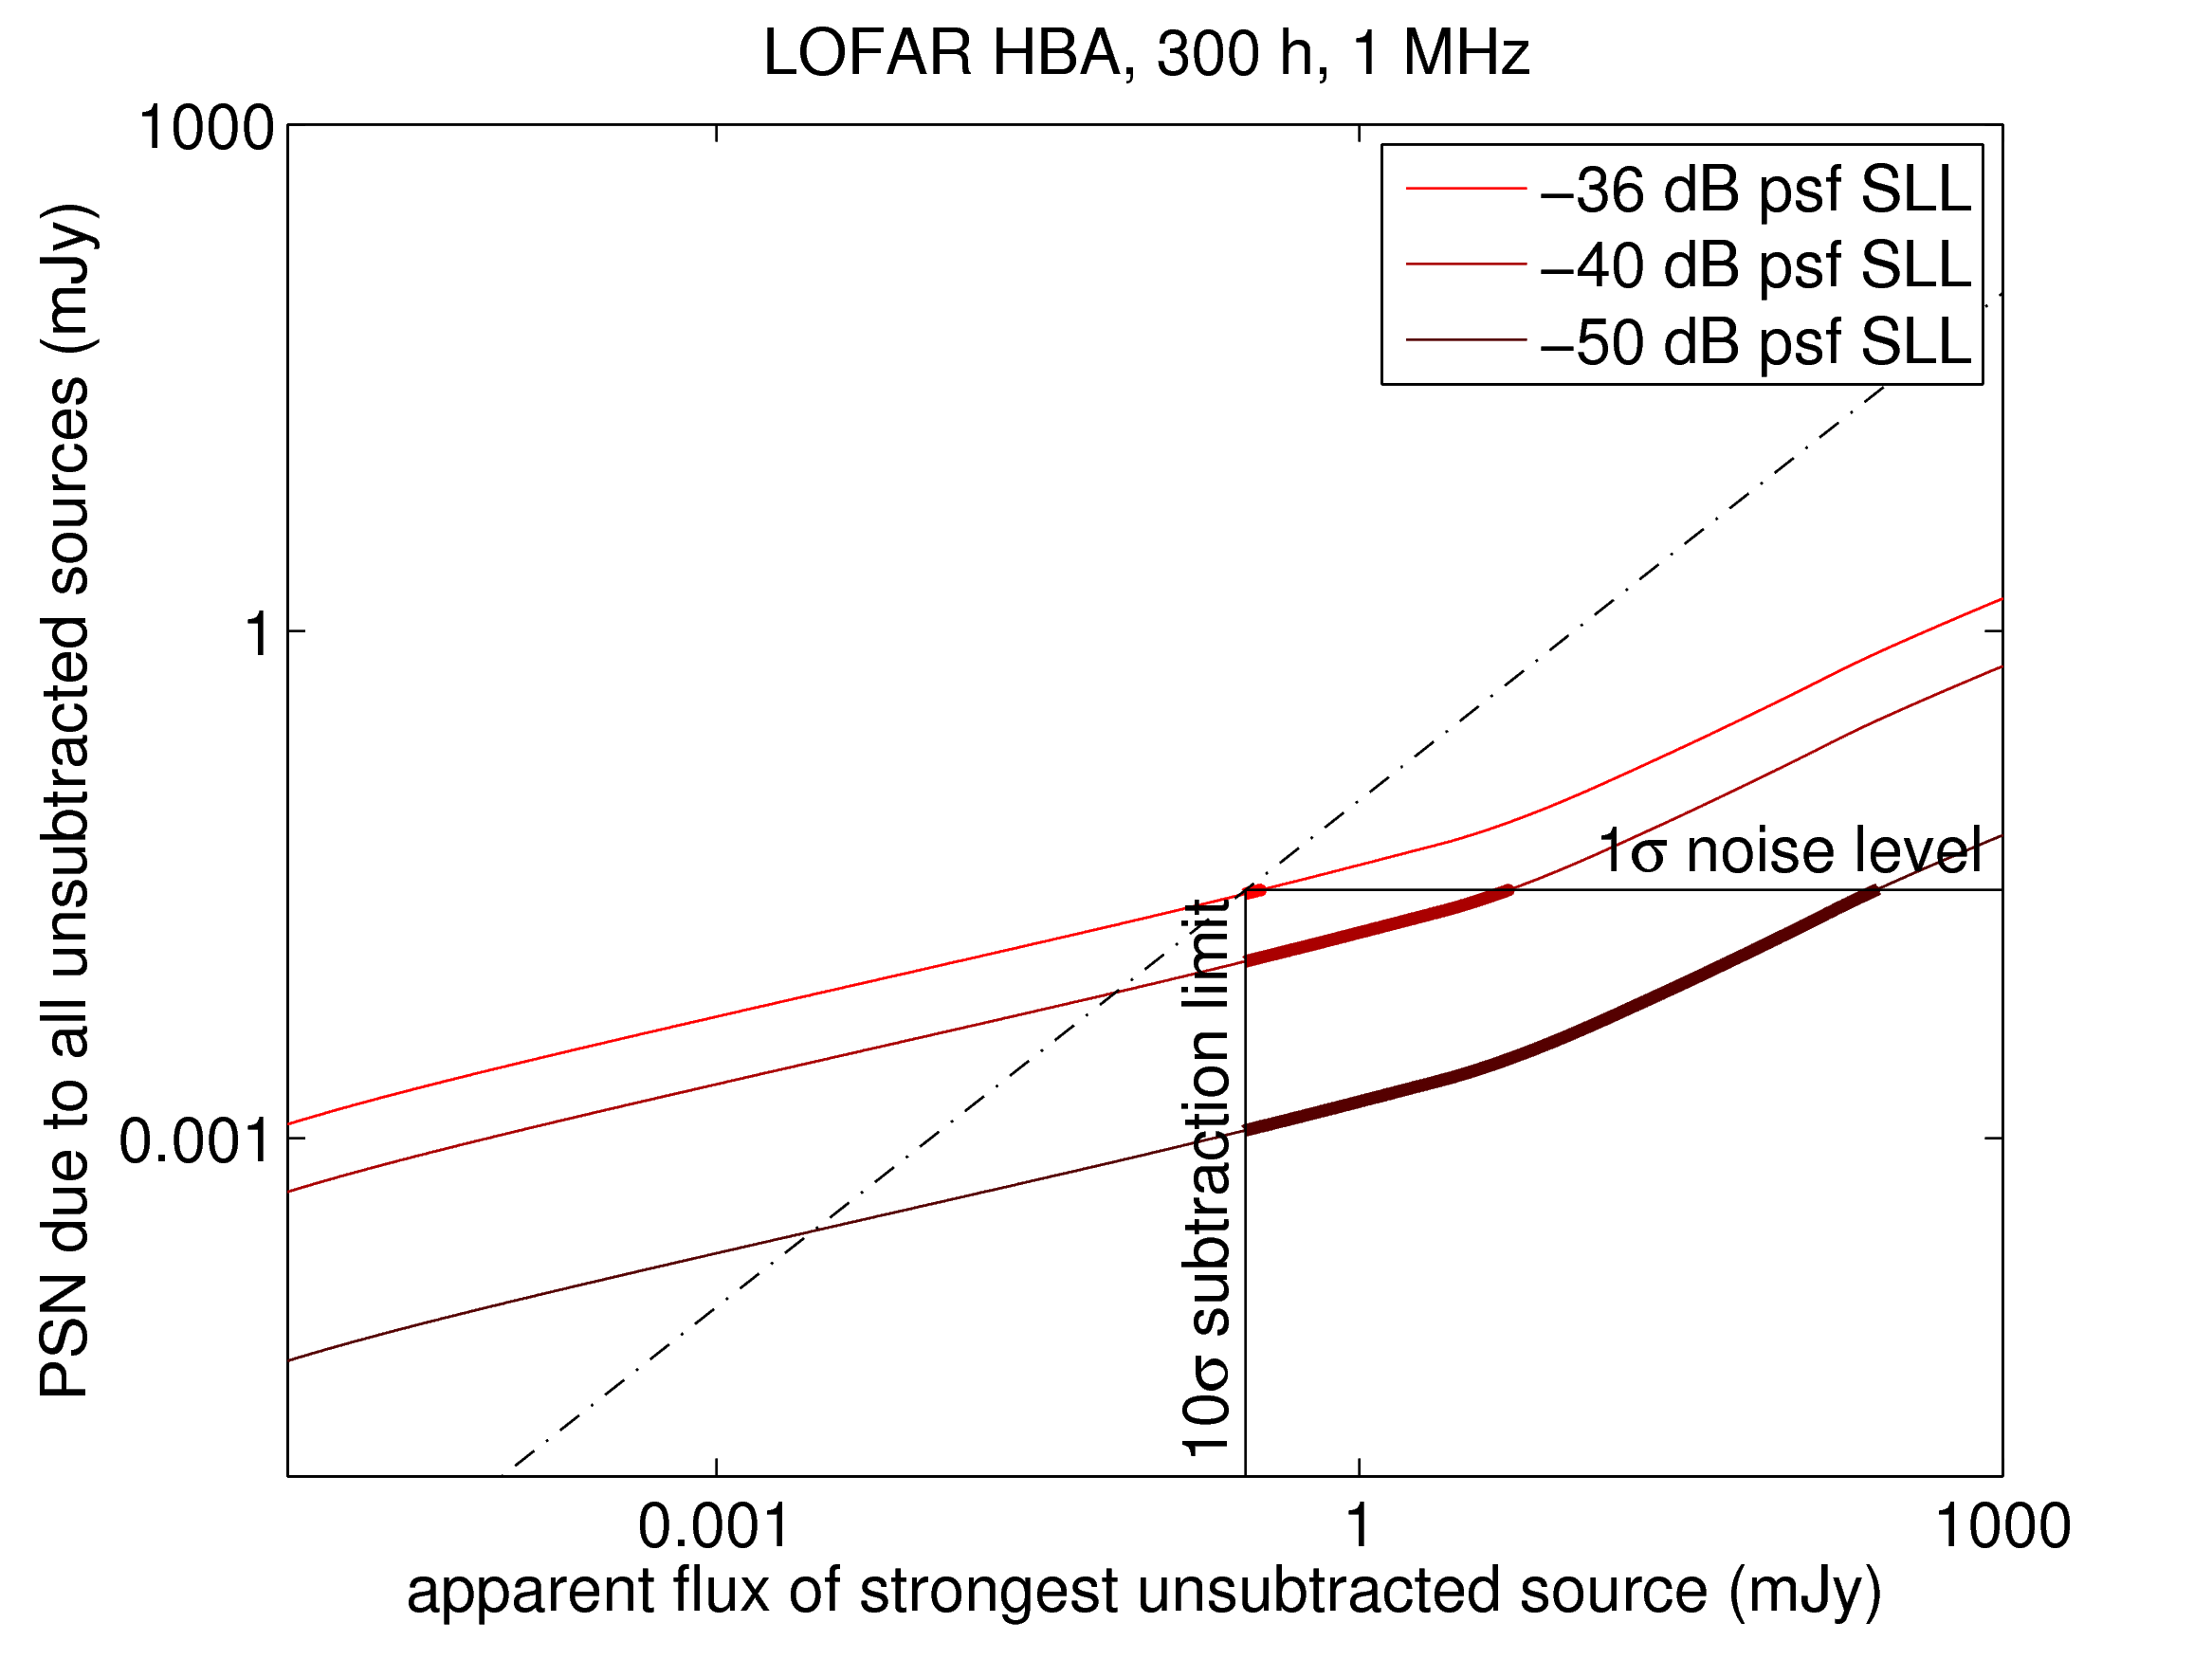
Calibratability fundamentals (4): psf sidelobe noise in LOFAR
| Submitter: | Stefan Wijnholds |
| Description: | In our previous image in this series, we demonstrated the importance of low psf sidelobes to prevent weak sources from drowning in the psf sidelobe noise (PSN) generated by the plethora of other weak sources in the image. This immediately begs the question: how low should our psf sidelobes be? Today, we address this question for LOFAR after 300 hours of integration with 1 MHz bandwidth, typical values for a single frequency slice of an EoR observation. The curves shown in the image above show the PSN levels as function of the flux of the brightest unsubtracted source (we assume that all brighter sources have been properly removed, including their sidelobes, by source subtraction) for different values for the RMS psf sidelobe level (SLL). Ideally, we want the PSN to be lower than the thermal noise in our image, i.e., we want to get the PSN below the horizontal line marked with "1-sigma noise level". As long as the PSN is higher than the thermal noise level, we need more source subtractions to remove more psf sidelobe responses from the image. Unfortunately, we cannot continue doing this forever, since we need to be able to properly estimate flux and position of the brightest source in the image to subtract it. Since PSN and calibration errors may add to the effective noise in the image, we assumed a 10-sigma thermal detection limit (indicated by the vertical line) to ensure at least a 5-sigma detection of the brightest source assuming that the effective noise is no more than two times the thermal noise in the image. Since we cannot work our way down the curves by source subtractions further than this limit, this means that the curves have to get below the thermal noise level before hitting the vertical line. In other words, the RMS psf SLL needs to be low enough that the corresponding curve goes through the rectangle in the bottom right of the plot. The relevant parts of the curves are indicated with a thick line. The curves are derived from observed source statistics while the density of sources below 0.08 mJy are extrapolations. For the LOFAR EoR regime we need to subtract sources weaker than the knee around 2 mJy where the RMS decays slowly and the number of sources increases steeply. As a result source finding and subtracting is far more tedious than at higher fluxes. From this analysis, we can conclude that LOFAR needs an RMS psf SLL of at most -36 dB, and then (as we will see in a future image) requires many more than 20,000 subtractions. This requires a nicely filled visibility plane, which LOFAR can only provide in the core area. Fortunately, that is the part of the array that will be used for the EoR analysis. If the RMS psf SLL can be lowered further by appropriate weighting of the visibility data, the PSN gets below the thermal noise after fewer source subtractions. Fewer source subtraction provide a significant computational benefit as will be demonstrated in a future image. |
| Copyright: | ASTRON |
| Tweet |  |