Daily Image
15-11-2016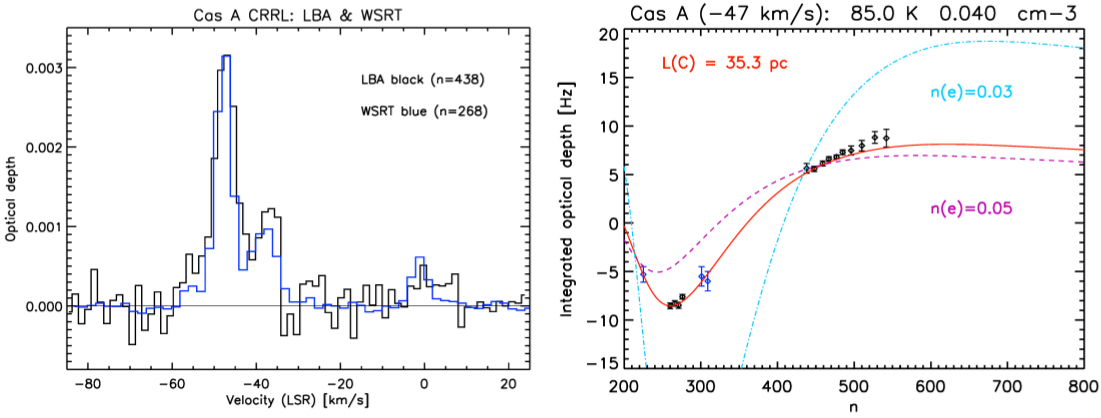
Carbon and hydrogen radio recombination lines from the cold clouds towards Cassiopeia A
| Submitter: | J. B. Raymond Oonk |
| Description: | The Low Frequency Array (LOFAR), thanks to its high spectral resolution, enables studies of the low-frequency universe not only in continuum, but also through spectral lines. In the context of the LOFAR Cassiopeia A Spectral Survey (LCASS), led by ASTRON astronomer R. Oonk, we are exploring the low frequency spectrum. In particular we use radio recombination lines (RRL) to determine the physical conditions (i.e. temperature and density) of cool, diffuse clouds. The main tracer of these clouds is the HI 21 cm line, but it is known to be difficult to obtain the physical conditions of the gas from this line. Low-frequency RRLs provide an important, complementary method. We have used the LOFAR Low Band Antennas (LBA) to perform a systematic high spectral resolution (0.4 kHz) investigation of the low-frequency 30-80 MHz spectrum along the line of sight to the famous supernova remnant Cassiopeia A (Cas A). We complemented the LOFAR observations with a 300-390 MHz Westerbork Synthesis Radio telescope observation (WSRT). In the first paper, of a planned series, we focus on the RRLs from carbon and hydrogen. We detect carbon RRLs (CRRL) in absorption with LOFAR and in emission with WSRT. Hydrogen RRLs (HRRL) are detected with WSRT. This is only the second time that the very weak HRRL lines have been detected in these clouds, and the WSRT measurement is the lowest frequency detection to date. The RRLs towards Cas A are known to arise in cold clouds in the Perseus spiral arm at -47 and -38 km/s. The deep LOFAR and WSRT observations provide us with high signal to noise detections over a large range in frequency. Measuring the frequency behaviour of RRLs is crucial and enables a detailed study of the gas conditions. We analyze the line optical depths and widths with our new RRL models (Salgado et al. 2016). These models provide the first physically consistent fit to all the available data and show that the CRRL clouds in the Perseus arm are best fit with an electron temperature 85 K and an electron density 0.04 cm^-3. The uncertainty on the temperature and density is less than 15%. Based on these results we argue that much of these CRRLs likely arise in the CO-dark surface layers of molecular clouds where most of the carbon is ionized but hydrogen has made the transition from atomic to molecular. Recent surveys and simulations show that about half of the diffuse, molecular ISM may reside in this CO dark phase. The CO-dark gas is difficult to observe directly and LOFAR may thus provide us with a new, powerful tracer of this phase. More detailed studies of the CRRL emitting gas and its relation with CO-dark and cool atomic gas are underway (Salas et al. in prep.). The results shown here have been accepted for publication in MNRAS (Oonk et al.) and can also be found here, http://adsabs.harvard.edu/abs/2016arXiv160906857O Figure: (Left) Overlay of the WSRT (blue) and LOFAR LBA (black) CRRL spectra for the line of sight to Cas A. The LBA spectrum has been inverted for this comparison and the WSRT spectrum was re-scaled to match the peak of the -47 km/s cloud in the LBA spectrum. There is a good match between the two indicating that all of the CRRL emitting gas is situated in front of the remnant. The weak line feature at 0 km/s is associated with the Orion spur. (Right) CRRL optical depth models overlaid on the measurements for the -47 km/s cloud. Our LOFAR and WSRT data is shown in black. In addition we show literature measurements in blue (Kantharia et al. 1998 and Payne et al. 1989). The optical depth is plotted as a function of quantum number n, where increasing n equals lower frequencies. The red curve shows the best-fit model (85 K and 0.04 cm^-3). In addition we show more models for the same best-fit temperature, but with a 25 percent difference in the density (dot-dash: 0.03 cm^-3 and dashed: 0.05 cm^-3). The large changes in the models with density (and temperature) highlight the strength of CRRLs in determining the physical conditions of the gas. |
| Copyright: | J.B.R. Oonk |
| Tweet |  |