Daily Image
10-10-2019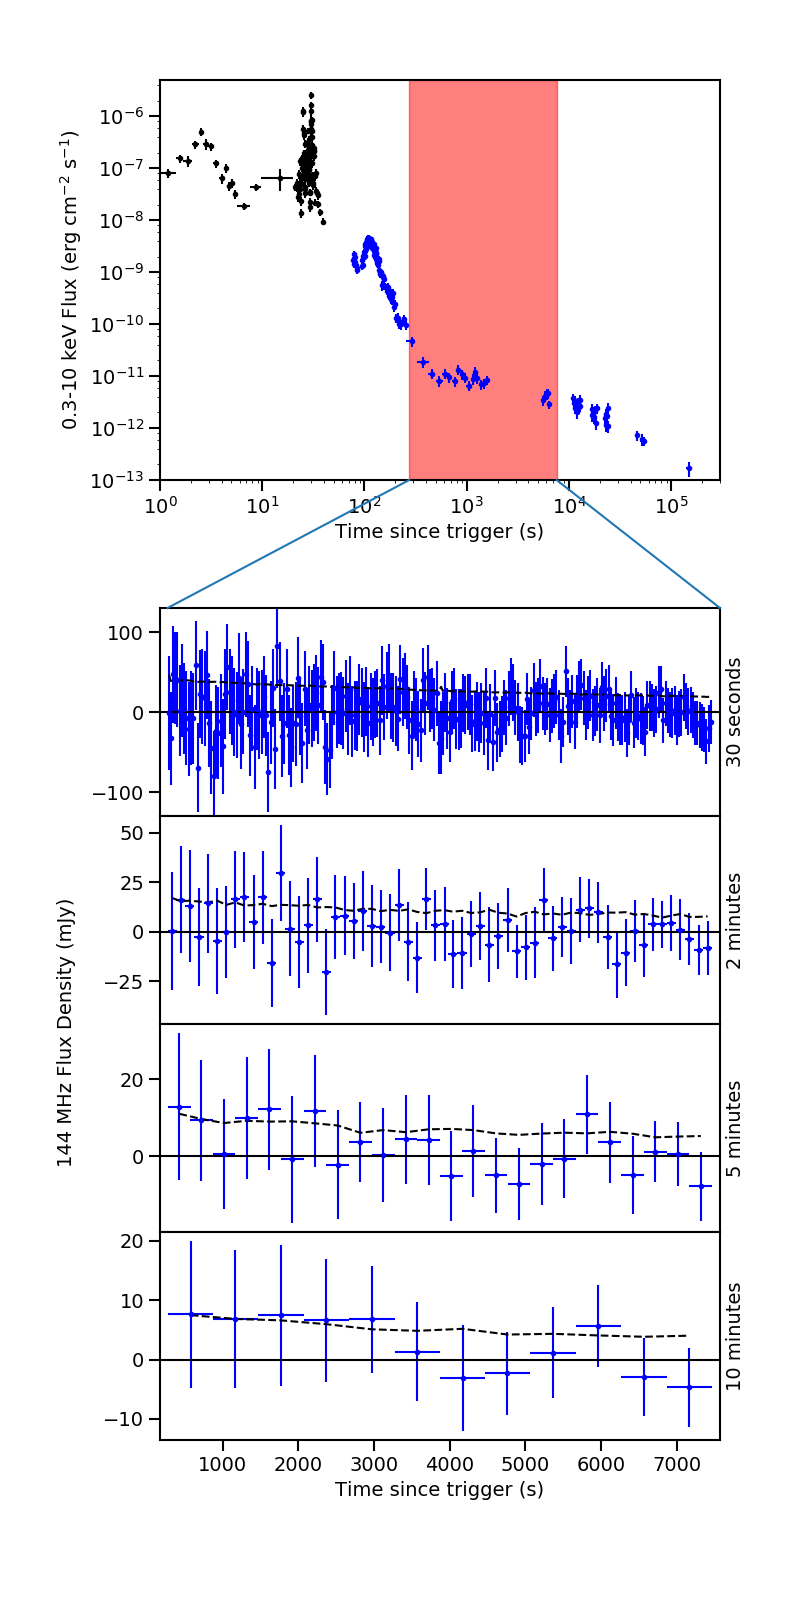
LOFAR early-time search for coherent radio emission from GRB 180706A
| Submitter: | Antonia Rowlinson |
| Description: | In the top panel of this figure we show the 0.3–10 keV flux light curve of GRB 180706A from the Swift Satellite. The black data points were obtained by the BAT (extrapolated to 0.3–10 keV) and the blue data points are from the XRT (observed at 0.3–10 keV). The red shaded region illustrates the time of the LOFAR observation. In the bottom panel, we plot the 144 MHz radio flux density obser- vations as a function of time since the GRB trigger obtained by LOFAR. We show four different snapshot time scales: 30 seconds, 2 minutes, 5 minutes and 10 minutes. The solid black line shows a flux density of 0 mJy and the black dashed lines in each of the LOFAR light curves are the rms noise of the images; measured from the inner 1/8th of the image. Rowlinson et al., 2019, MNRAS accepted Paper available here: https://ui.adsabs.harvard.edu/abs/2019arXiv190902958R/abstract |
| Copyright: | Antonia Rowlinson |
| Tweet |  |