Daily Image
15-10-2019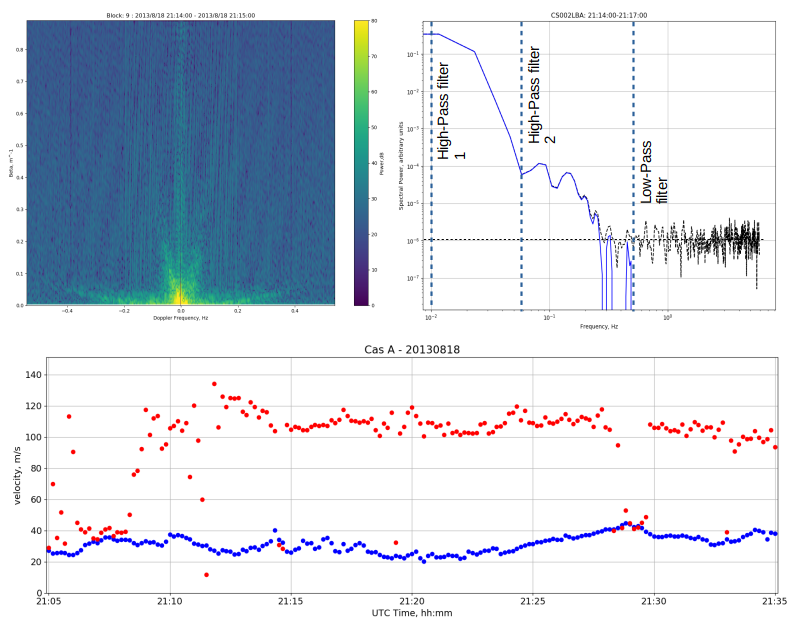
Scintillation from two Layers in the Ionosphere
| Submitter: | Richard Fallows |
| Description: | A LOFAR observation of ionospheric scintillation on Cassiopeia A taken back in August 2013 has been puzzling me since it was taken. The observation was set up to record dynamic spectra from each station individually. Delay-Doppler spectra (the 2-D FFT of a dynamic spectrum - top left plot) calculated from 5-minute segments of the dynamic spectra recorded by LOFAR core stations showed twin "scintillation arcs", which indicate the scintillation pattern is probably the result of scattering from two different layers in the ionosphere, potentially travelling at different speeds. The scintillation pattern can be seen quite clearly flowing over the core stations in a movie of it (not shown), heading north-west to south-east. There are hints at times of another flow, but tracking it down has eluded me... Until now. The velocity of the scintillation pattern can be assessed from cross-correlating time series’ of the intensities (obtained by averaging over a limited bandwidth) received by different station pairs: Each cross-correlation function peaks at a non-zero time lag, velocities are calculated from these time lags and the baselines of the antenna pairs. Further analysis which space precludes me from detailing here reveals the most likely actual velocity. Cross-correlation functions are calculated by multiplying the power spectrum of one time series by the complex conjugate of the power spectrum of the other. The power spectra are first filtered to exclude the DC-component and high-frequency white noise before multiplication. The top right plot shows an example power spectrum. Typically these spectra show an initial flat part, turning over to approximately follow a power-law decrease to the white noise at high spectral frequencies. In this spectrum two components are seen, which can be separated by applying different high-pass filter values (labelled as 1 and 2 on the plot). When all the cross-correlation functions are re-calculated using each high-pass filter value the resulting velocities change. The lower plot shows the velocities calculated using the high-pass-1 value (blue) and high-pass-2 value (red). The blue velocities correspond to the steeper scintillation arc seen in the delay-Doppler spectrum, and appear to come from the F-region in the ionosphere; red velocities from the shallow arc, appearing to come from a much lower layer corresponding to the E-region. Two medium-scale travelling ionospheric disturbances, travelling in perpendicular directions are thought to be responsible for the scintillation seen. |
| Copyright: | ASTRON |
| Tweet |  |