Daily Image
24-08-2022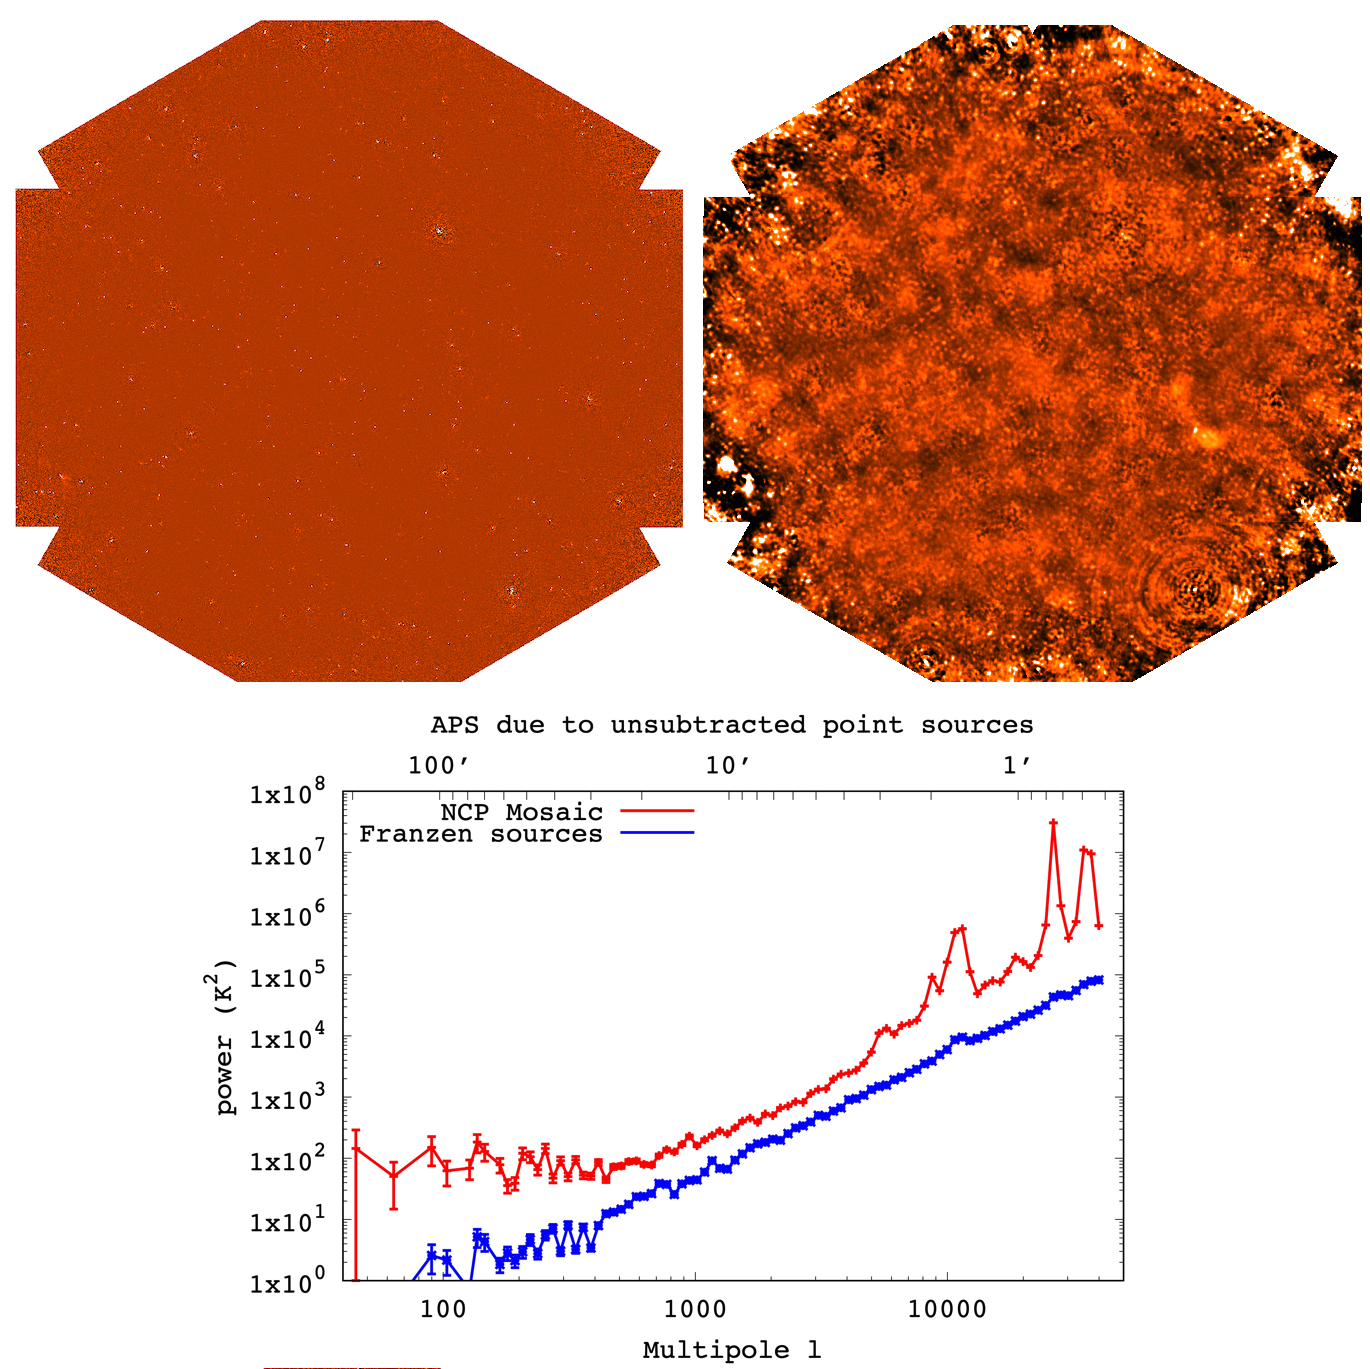
The anisotropy of the diffuse radio background
| Submitter: | Fraser J Cowie |
| Description: | Widefield LOFAR HBA observations of a 16 degree patch of sky centered on the North Celestial Pole were used to measure the diffuse radio background. On the left a cleaned image of the numerous bright and faint radio sources is shown. On the right is a naturally weighted image of what is left after these sources are subtracted out. This is the radio background. Structure in the radio background on degree scales and below is seen along with a mysterious diffuse bright patch in the lower right of the image. An outstanding mystery of the radio background is that several surveys and experiments (ARCADE 2, Haslam sky map, to name a few) have measured an excess power in the background beyond what is predicted by source counts and models. These are monopole measurements (overall power), and did not probe the anisotropy (smoothness) of the radio background. To investigate the anisotropy of the background an angular power spectrum, which quantifies the power of variations on different angular scales, is measured from images of the diffuse background. The measured angular power spectrum is plotted below the images, along with a prediction for unremoved point sources in the background image using source count data (Franzen et al. 2016). An excess anisotropy power above what is expected is found, meaning that the radio background is not as smooth as it should be. There is evidence that certain types of clustering of sources may be able to replicate this excess but for now this is just another mystery of the radio background! |
| Copyright: | F J Cowie |
| Tweet |  |