| Description: | The first stars, black holes and galaxies in the early Universe appeared and evolved during the Cosmic Dawn and Epoch of Reionization. The redshifted 21-cm spectral signature of neutral hydrogen as a probe of the Cosmic Dawn and Reionization epochs promises to provide valuable insights into the (astro)physical processes that governed the structure formation in the early Universe. Several experiments have made steady progress towards detecting the redshifted 21-cm signal from the Cosmic Dawn, such as EDGES which reported an unusual 21-cm absorption feature in the sky-averaged spectrum, and SARAS3 which reported the first non-detection. To understand the astrophysical origin of the EDGES signal, we commenced the AARTFAAC Cosmic Explorer (ACE) programme as an interferometric follow-up of the reported EDGES detection. The ACE programme focuses on the measurement of the power spectrum of 21-cm signal fluctuations at redshift z~18 using the AARTFAAC wide-field imager of LOFAR in 12-station mode. In Gehlot et al. 2020, we reported the first limits on the 21-cm signal of <(8K)^2 at k=0.144 hcMpc^-1 at z~18 using 2 hours of data collected with AARTFAAC collected during the ACE observing campaign. We have made significant improvements in the data processing and analysis strategy of the ACE data, introducing data quality assessment, and mitigating various contamination effects such as calibration, RFI environment, and ionospheric effects. I will talk about the updated ACE analysis and improvements, the investigation of the RFI environment and ionospheric conditions, and what's next for AARTFAAC in the LOFAR-2.0 era.
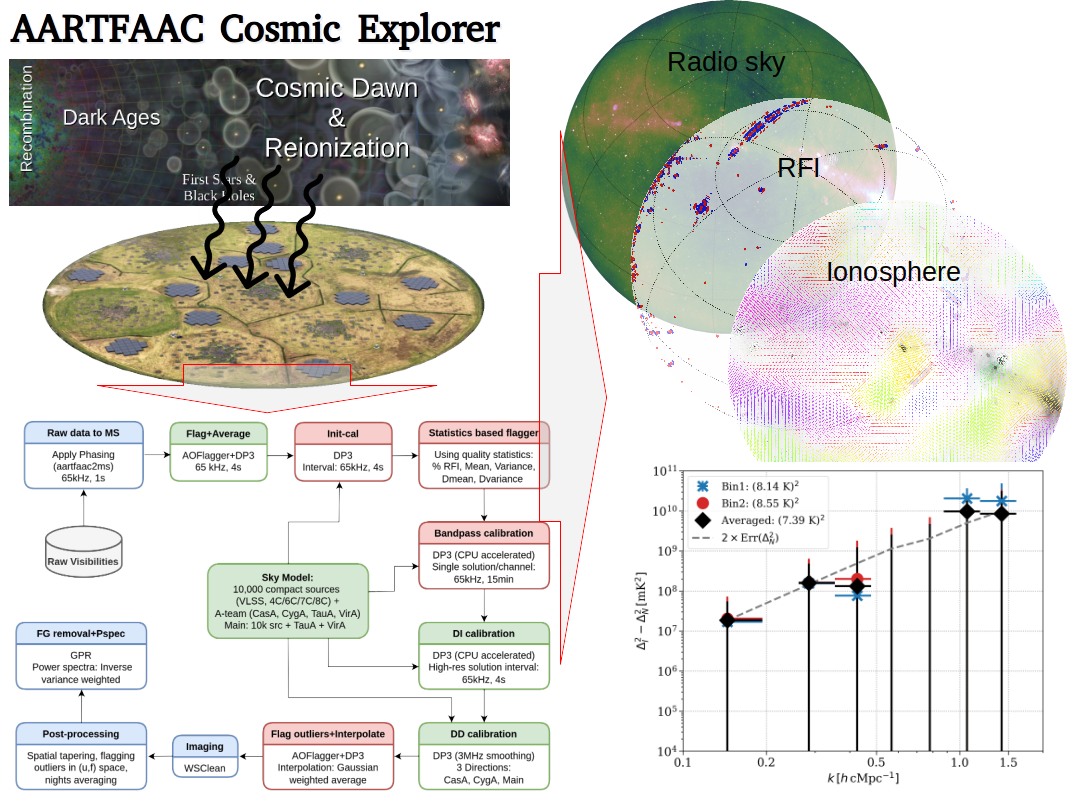
The image is a depiction of the various aspects of the AARTFAAC Cosmic Explorer programme, starting from the key science goal of measuring the redshifted 21-cm signal from the Cosmic Dawn, the updated data processing and analysis pipeline, a range of images from the investigation of foregrounds, RFI, and ionosphere. Finally, a plot showing the upper-limits on the 21-cm signal at z~18 reproduced from Gehlot et al. (2020). |