Daily Image
26-11-2024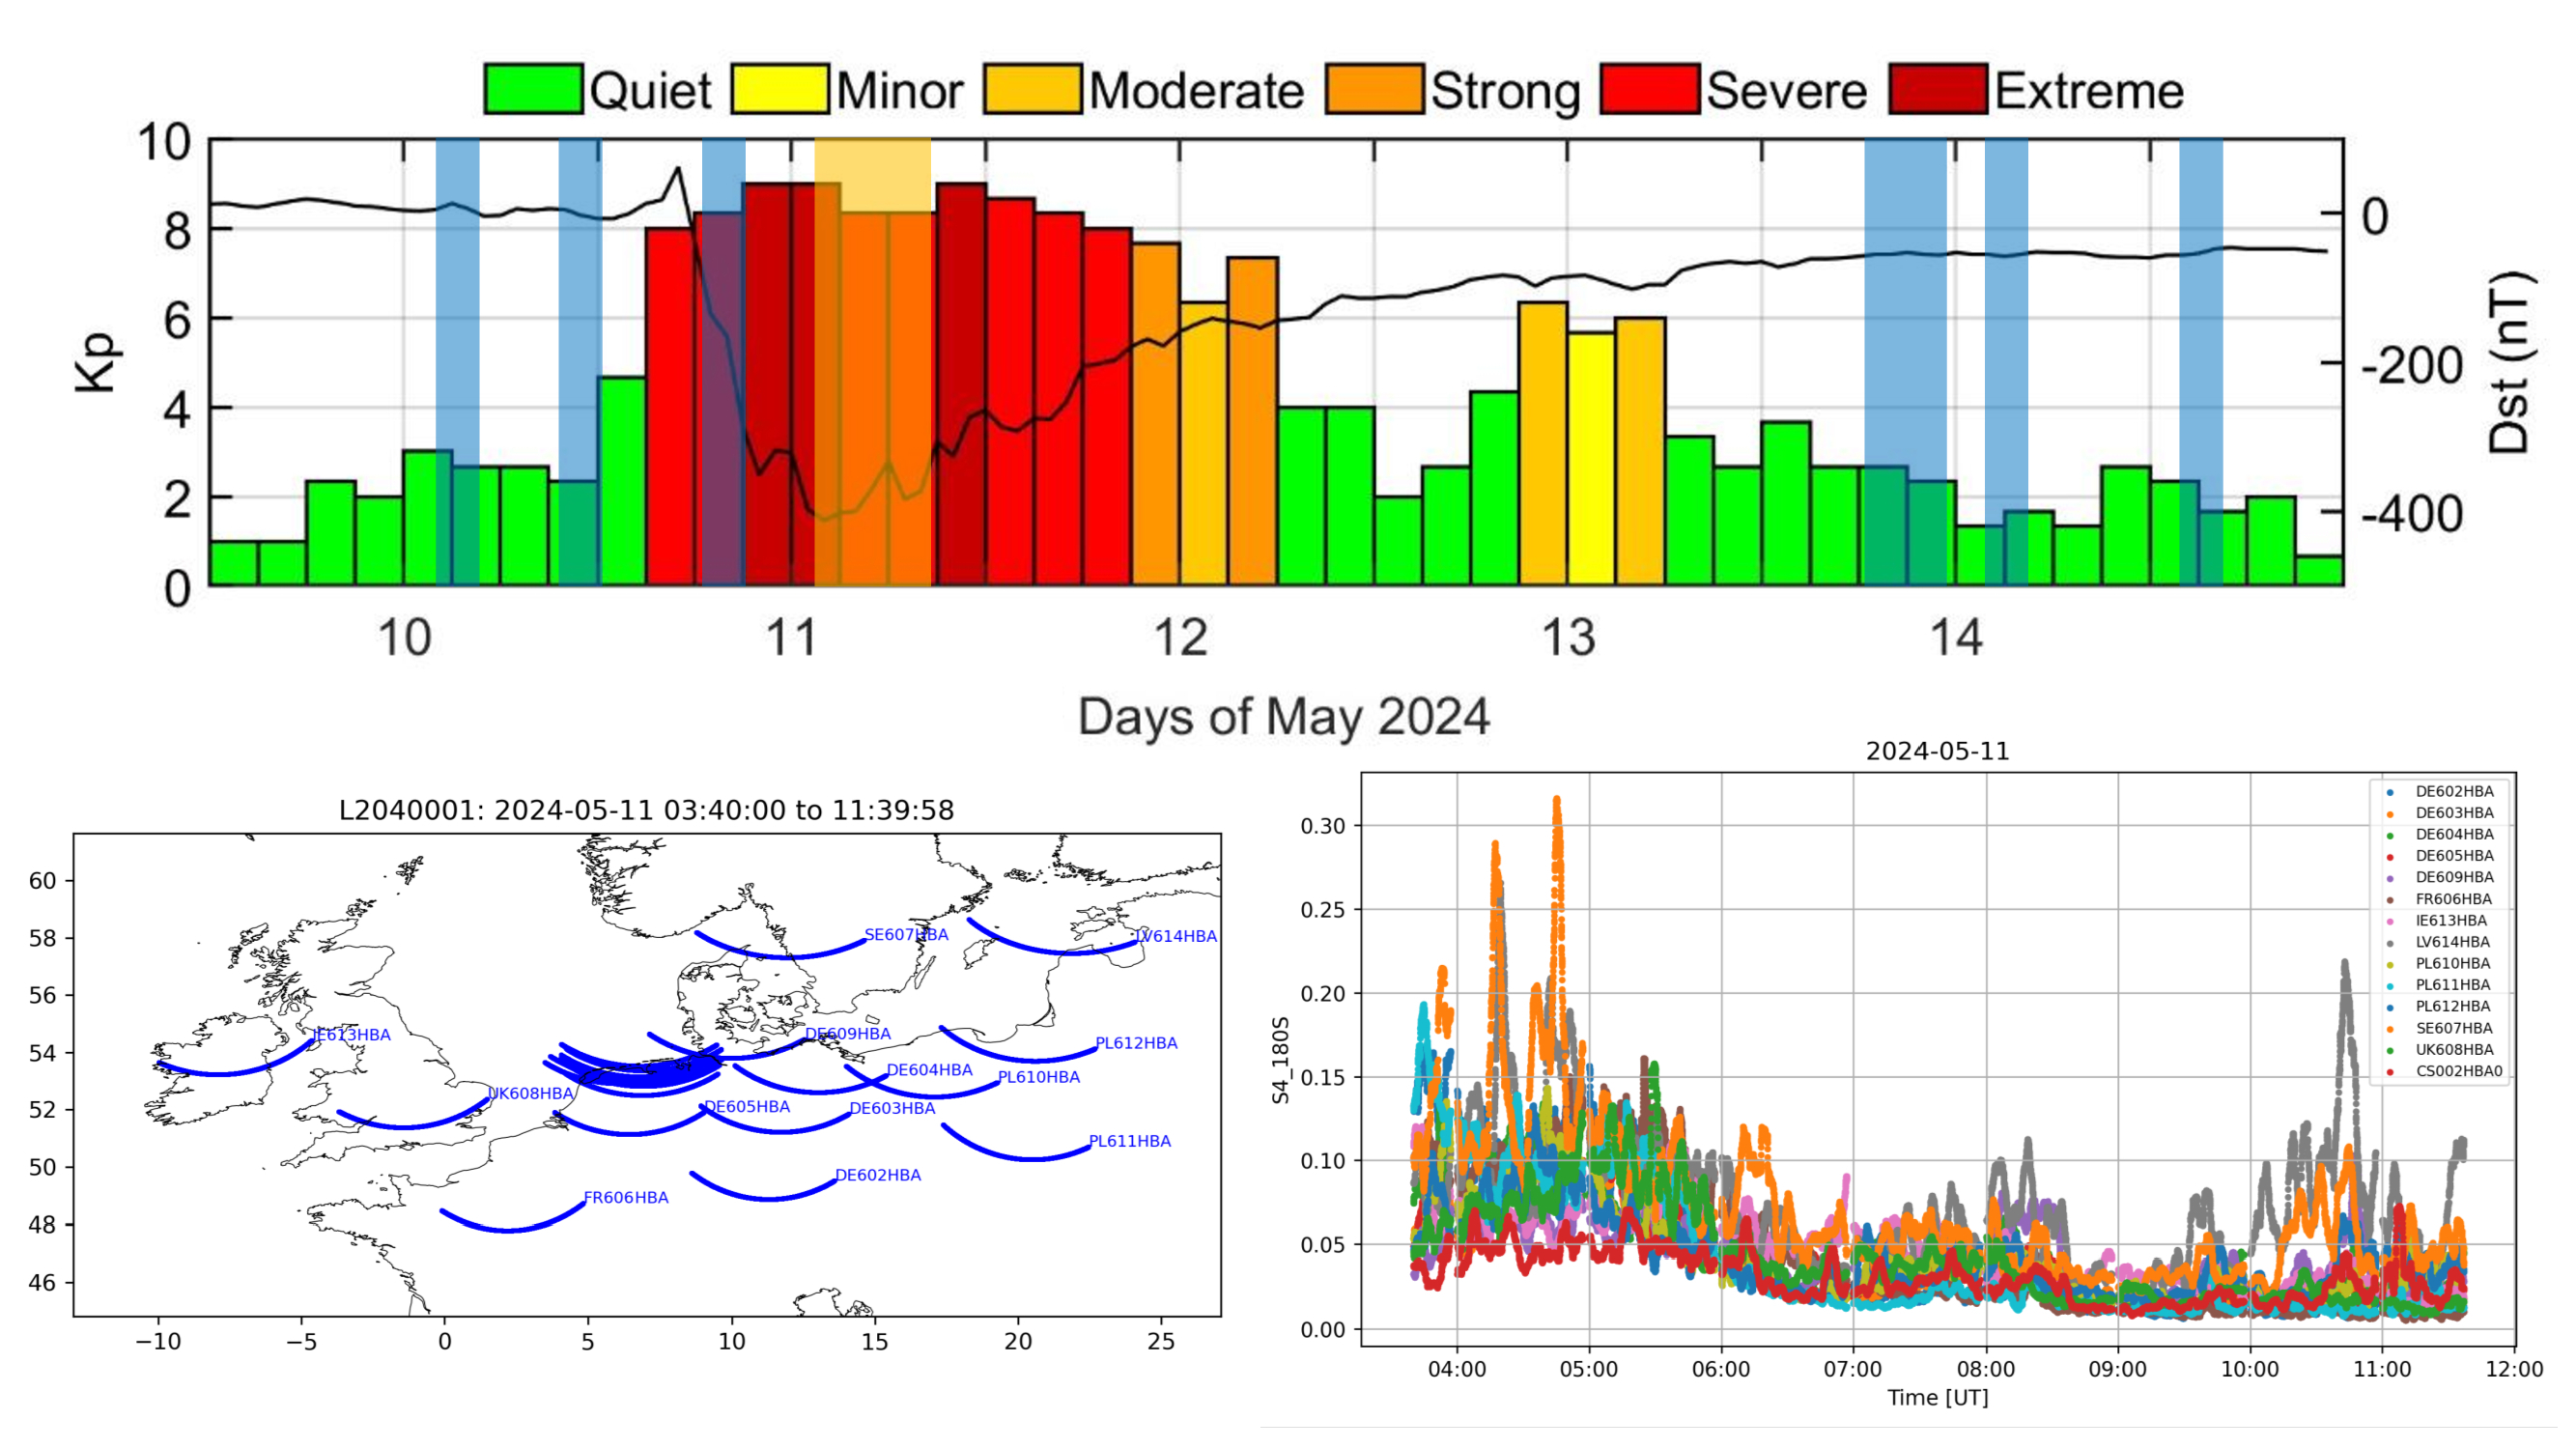
Mother's day storm as seen by LOFAR
| Submitter: | Rebecca Ghidoni and Maaijke Mevius |
| Description: | Remember that strong geomagnetic storm in May this year? When the aurora extended far south and we could see the Northern light with the naked eye even at the LOFAR site in Exloo? LOFAR was doing standard interferometric observations at that time, but unfortunately, due to the wild ionospheric conditions, these data could not be used for the science cases they were meant for. However, with the help of some alert people at the observatory, we were able to save the autocorrelations of these data for ionospheric studies. In the upper plot the development of the geomagnetic storm in time is shown in terms of Kp (colored histogram) and Dst (black line) indices (adapted from Spogli et al., 2024, doi:10.4401/ag-9117), with the available LOFAR observations in shaded blue and orange imposed. The Kp and Dst indices provide a global measure of the geomagnetic activity based on variations in Earth's magnetic field, at subauroral and equatorial latitudes, respectively. The positions of the ionospheric pierce points (at an altitude of 350 km) from the longest LOFAR observation are shown in the lower plot. The lower right plot shows measured ionospheric scintillation indices of the same observation with different LOFAR stations. During the storm the dedicated LOFAR space weather station (IDOLS) was also monitoring the ionosphere continuously. A publication in which all these data are combined with companion observations of ionospheric disturbances, such as GNSS data, is underway. These data demonstrate that even when the conditions are too bad for regular radio astronomical observations, science can come out of your data! We especially would like to thank S. ter Veen (Astron) for his help obtaining the data and the PIs of all the involved LC20 projects for kindly agreeing to make the data available for ionospheric studies. |
| Copyright: | Rebecca Ghidoni (INGV) |
| Tweet |  |