Daily Image
29-02-2012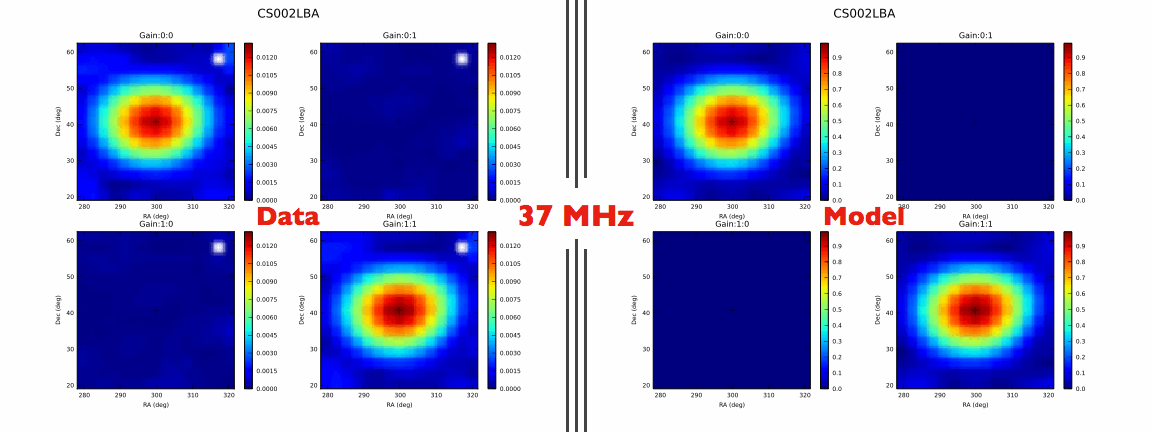
Mapping LOFAR beams
| Submitter: | George Heald |
| Description: | Perhaps the most novel aspect of the LOFAR telescope is its beamforming capabilities. Rather than physically moving big heavy dishes, the signals from the individual fixed dipoles within a LOFAR station are digitally combined to virtually "point" the telescope. This electronic pointing technique results in a tremendous flexibility in forming the digital beams, and allows us to observe in multiple directions, simultaneously. LOFAR can look in up to 244 directions, all at the same time! In order to verify this multi-pointing capability, as well as check the shapes of the beam patterns formed by the LOFAR stations, we have recently run a series of observational tests centered on Cygnus A. By observing the target source with 225 beams at various offsets (on a square grid of 15x15 pointings), we have a direct measure of the sensitivity in each of those locations. By plotting the sensitivities as an image, we obtain a picture of the LOFAR beam! In these beam maps, each pixel corresponds to one single pointing. The stations were used in their LBA_INNER configuration (which has a diameter of 30 meters). For the experts, each of the four panels shows the amplitude of one element of the 2x2 complex Jones matrix describing the beam. The animation shows the LOFAR beams that we have determined observationally (on the left), at several different frequencies, and compared with the predictions of the LOFAR beam model (on the right). White pixels indicate parts of the observation that dropped out due to glitches. Note that the angular size of these panels is just over 40x40 degrees - LOFAR is sensitive to huge portions of the sky at once! The first thing that you will notice is that the beam gets smaller as the observing frequency increases, just as expected. It is also clear that the observed data and the model predictions are extremely similar. These beam maps are shown for CS002 (located on the superterp), which is one of the best-behaved stations in the array. Maps were also simultaneously created for most of the other stations in the array. We now have a huge amount of LOFAR beamshape data to study ... and all from only six minutes of observing time! |
| Copyright: | ASTRON/LOFAR |
| Tweet |  |