Daily Image
18-01-2013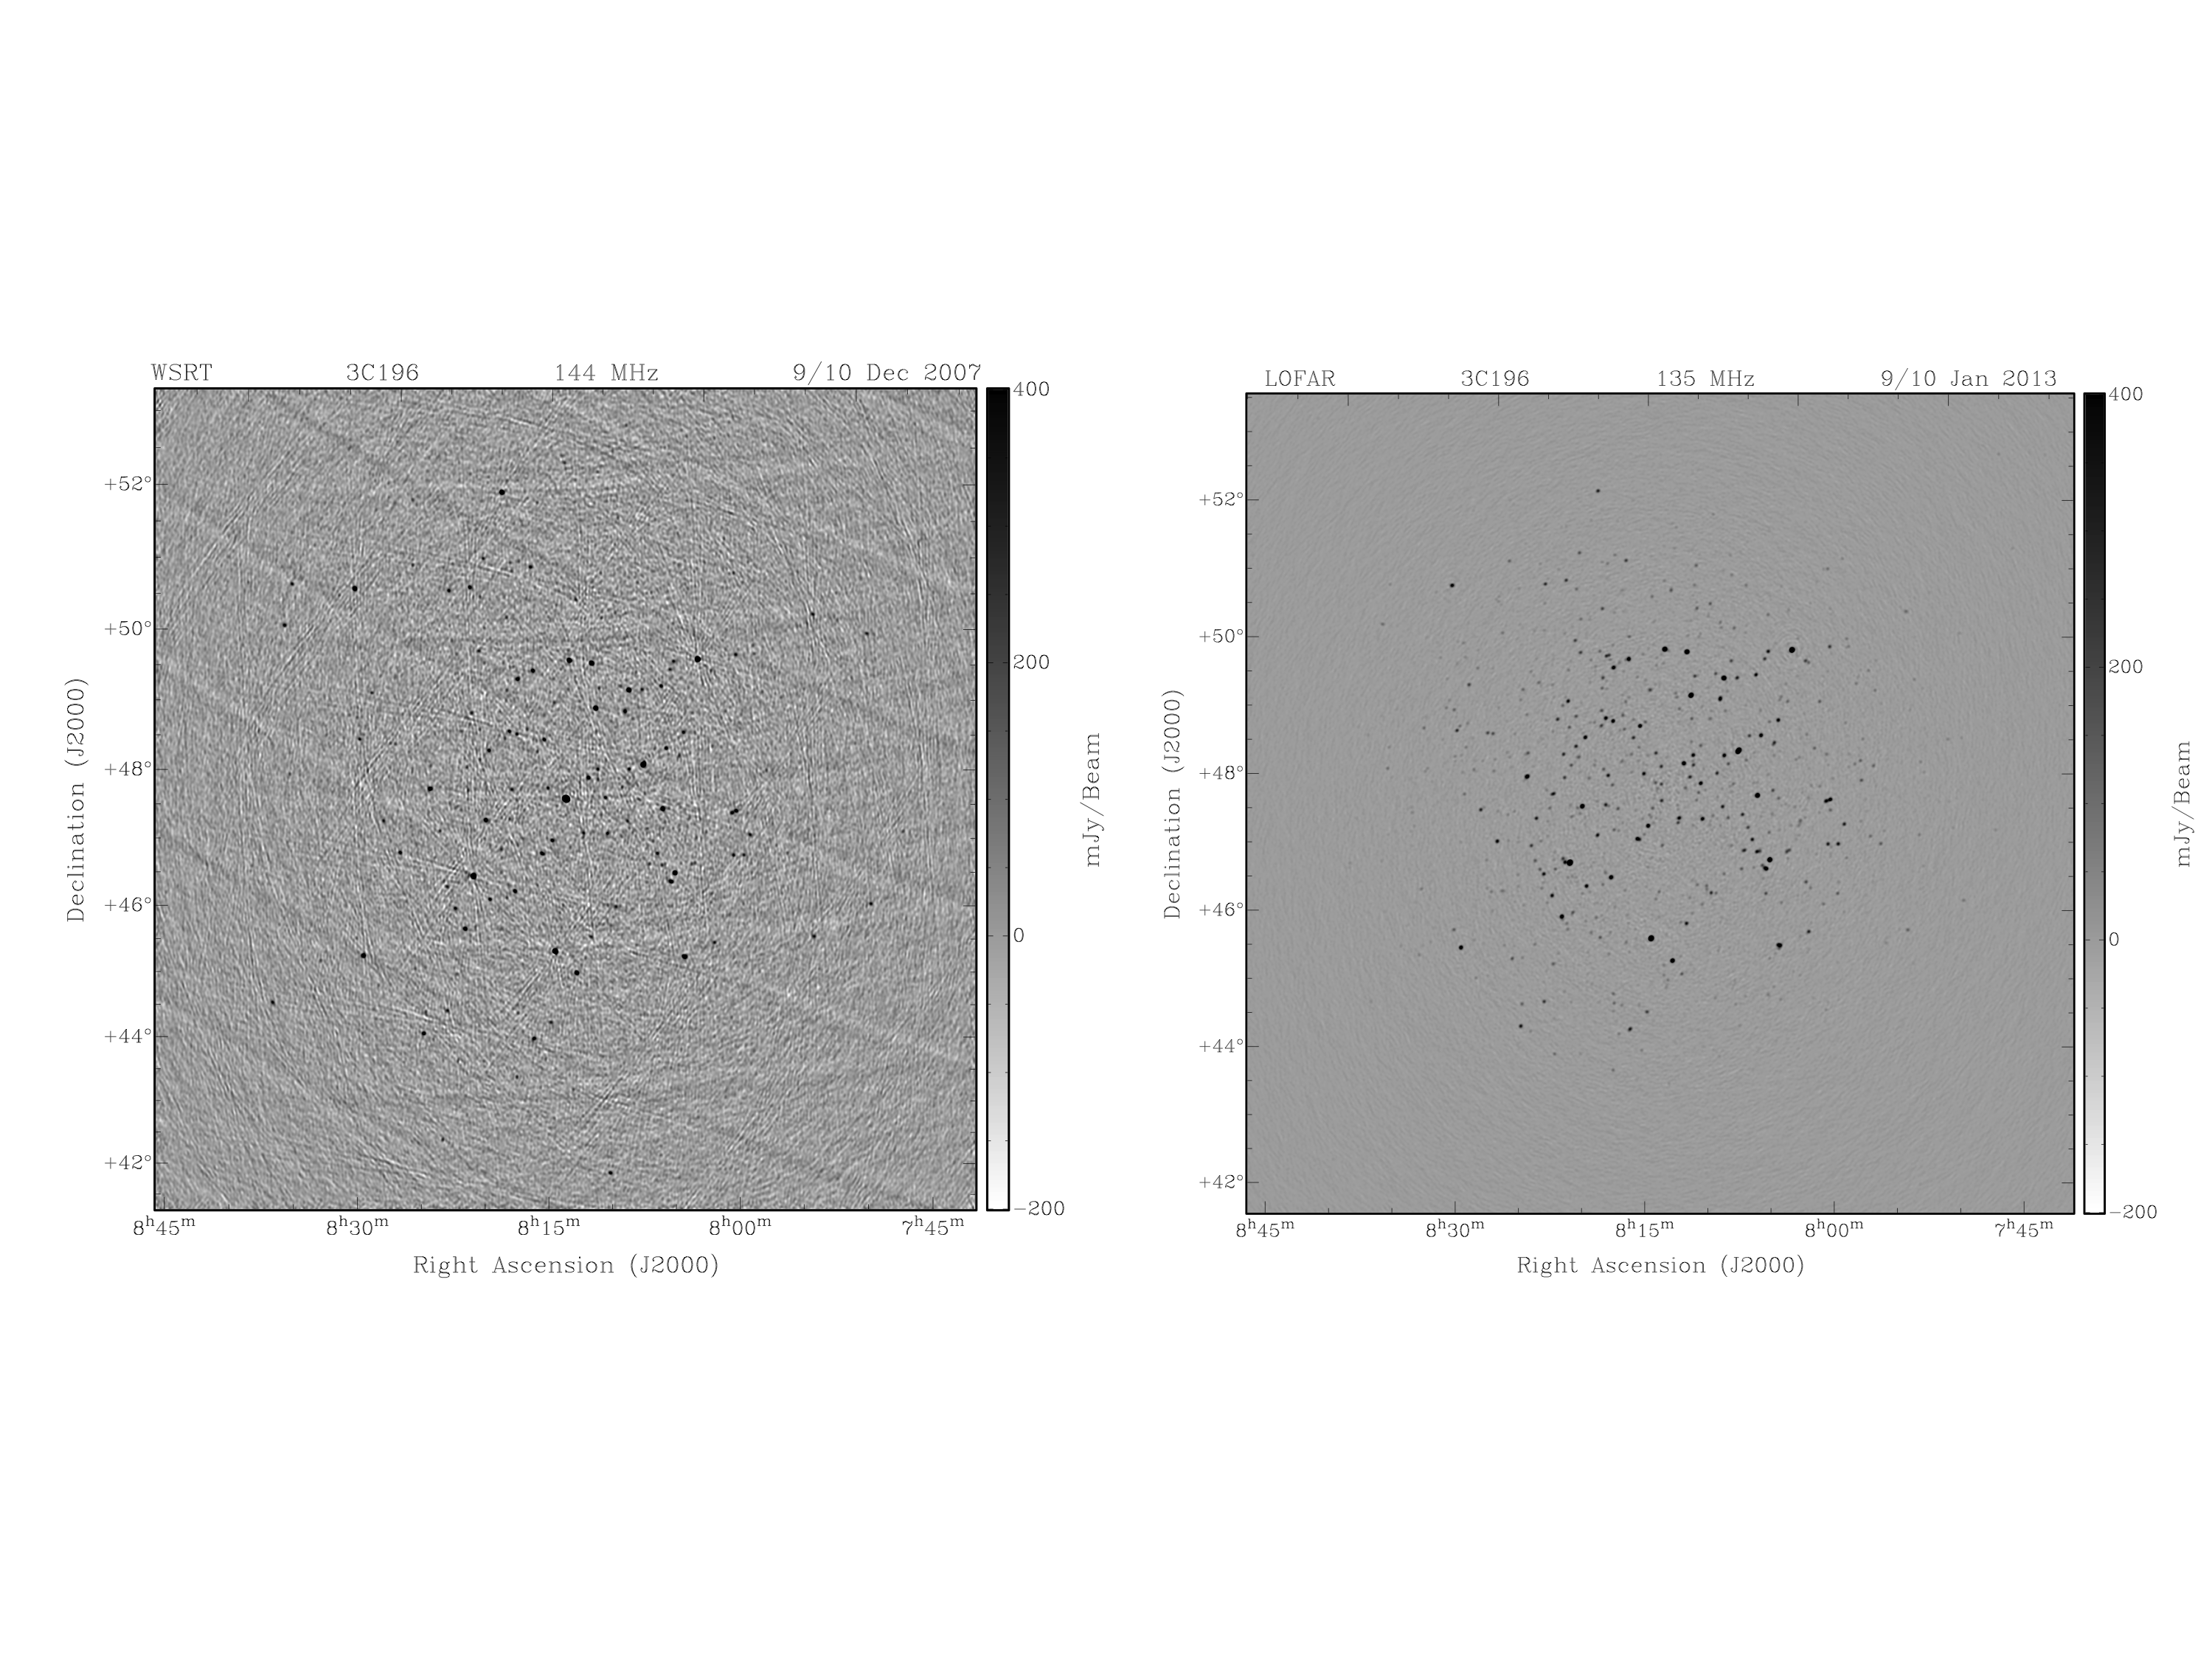
WSRT versus LOFAR
| Submitter: | Ger de Bruyn |
| Description: | Preparing for the calibration and imaging with LOFAR at frequencies from 120-180 MHz has proceeded on many fronts. One of the most instructive and effective ways was by using the WSRT at similar frequencies using the Low Frequency Front Ends (LFFEs). The deepest images with the WSRT at those frequencies were obtained on the field centered at the compact quasar 3C196, which has a flux of 80 Jy at 144 MHz. These results are described in a paper by Bernardi et al (A&A 522, A67,2010). After a lot of processing, involving 6x12h of data, we reached a noise level of 0.6 mJy, representing a dynamic range exceeding 100,000:1. We are now quite familiar with WSRT images of this quality and much higher. LOFAR, an array with tens of thousands of dipoles should, in theory, be able to go much deeper. However, we first had to prove high dynamic range imaging with a phased array, with its time variable beams and complicated Measurement Equation ! ! That this was possible had been predicted by a.o. Jaap Bregman, and has by now been shown at this spot and in recent papers by Sarod Yatawatta and others. The two images (left WSRT, right LOFAR) shown above now conclusively show that we have in fact done much more than this. To make a fair comparison between WSRT and LOFAR I have used datasets with similar uv-coverage (2.7 km maximum baseline), bandwidth (0.18 MHz), frequency (135 vs 144 MHz) as well as integration time (12h vs 8h). For LOFAR we only used the core array to give it ismilar resolution as the WSRT (2.7 km). Processing of the WSRT and LOFAR datasets was done with NEWSTAR, respectively BBS, and consisted of a single direction-independent calibration with one discrete source (3C196). The brightest sources in the WSRT image were subtracted and restored, including 3C196 itself. No deconvolution or source subtraction (except 3C196 itself) was done to make the LOFAR image. The noise levels in the images shown are 35 mJy (WSRT, left) and 3.5 mJy (LOFAR, right), in both cases only a factor of 2 away from the thermal noise. The factor 10 improvement in the LOFAR image corresponds exactly to the product of the SEFD for individual stations/telescopes (7500 Jy vs 2500 Jy) and the number of stations/telescopes (13 vs 46) ! Other notable differences between the two images are the narrower primary beam of LOFAR (a 30m untapered station, as opposed to a highly tapered 25m WSRT dish) and the presence of significant sidelobes (grating lobes) from CasA and CygA in the WSRT image (see also my AJDI of 24-Nov-2008). Also ionospheric effects (spikes) are more pronounced in the WSRT image around the secondary sources. I leave it as an exercise for the reader to find the reasons behind this. The bottom line: calibrating and imaging with a phased array is as easy as with the WSRT, and already gives superior results (factor 10) within the same time and without much effort: Q.E.D. |
| Copyright: | Ger de Bruyn |
| Tweet |  |