Daily Image
21-10-2013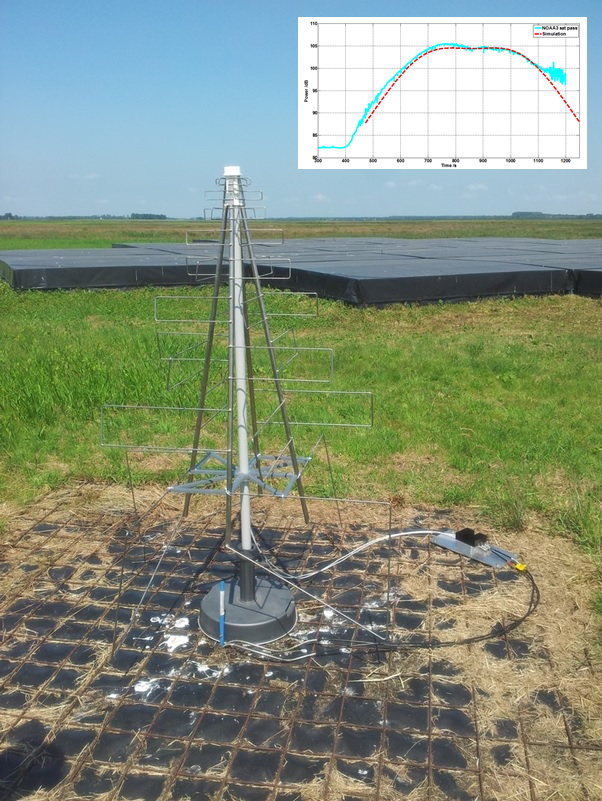
SKALA & LOFAR
| Submitter: | Jan Geralt Bij de Vaate |
| Description: | As part of the development work for the SKA-low instrument, Menno Norden from ASTRON and Eloy de Lera Acedo and Nima Razavi-Ghods, from the University of Cambridge, performed several tests on the SKALA (SKA Log-periodic Antenna) element during the week 8-12th July 2013. SKALA, designed at the University of Cambridge, was connected to the LOFAR HBA back end in order to perform a series of tests including: antenna pattern measurements using satellite passes, measurement of the spectrum with the active SKALA element, tests of SKALA LNAs stability over time, cross correlation tests with HBA tiles (X and Y polarizations) and beam-forming using SKALA as an HBA tile. In order to have access to power and signal transport for connection to the receivers, SKALA was installed in place of one of the LOFAR LBA calibrator elements (element 46) in station CS013. This position is separated from the LBA elements which eliminated the risk of electromagnetic interactions with the rest of the LOFAR antennas. However, due to the working band of SKALA (50-650 MHz), it was not convenient to connect it to the LBA receiver, but to the HBA receiver. The flexibility of the LOFAR system made this possible. The LOFAR HBA tile 21 (the closest to the SKALA position) was disconnected from the LOFAR HBA receiver board and SKALA was connected in its place using the cables from the LBA element 46. The pattern measurement using satellite passes had been performed previously in order to measure the LOFAR HBA tile beam shape. In this case, a much wider beam was measured, which meant that a correction had to be made for the trajectory of the satellite, as this is not spherical over the antenna and therefore for large fields of view a significant effect can be appreciated due to path loss. The information on frequency and location of the satellite was obtained from the Orbitron software. In the plot we can see a pass of satellite NOAA3 (NOAA stands for National Oceanic and Atmospheric Administration) over the location of station CS013 in the LOFAR core. In the plot we can see the measured pattern of SKALA (after correcting the satellite data for path loss) and the comparison with the simulations at 137 MHz. |
| Copyright: | Eloy de Lera Acedo |
| Tweet |  |