Daily Image
09-06-2015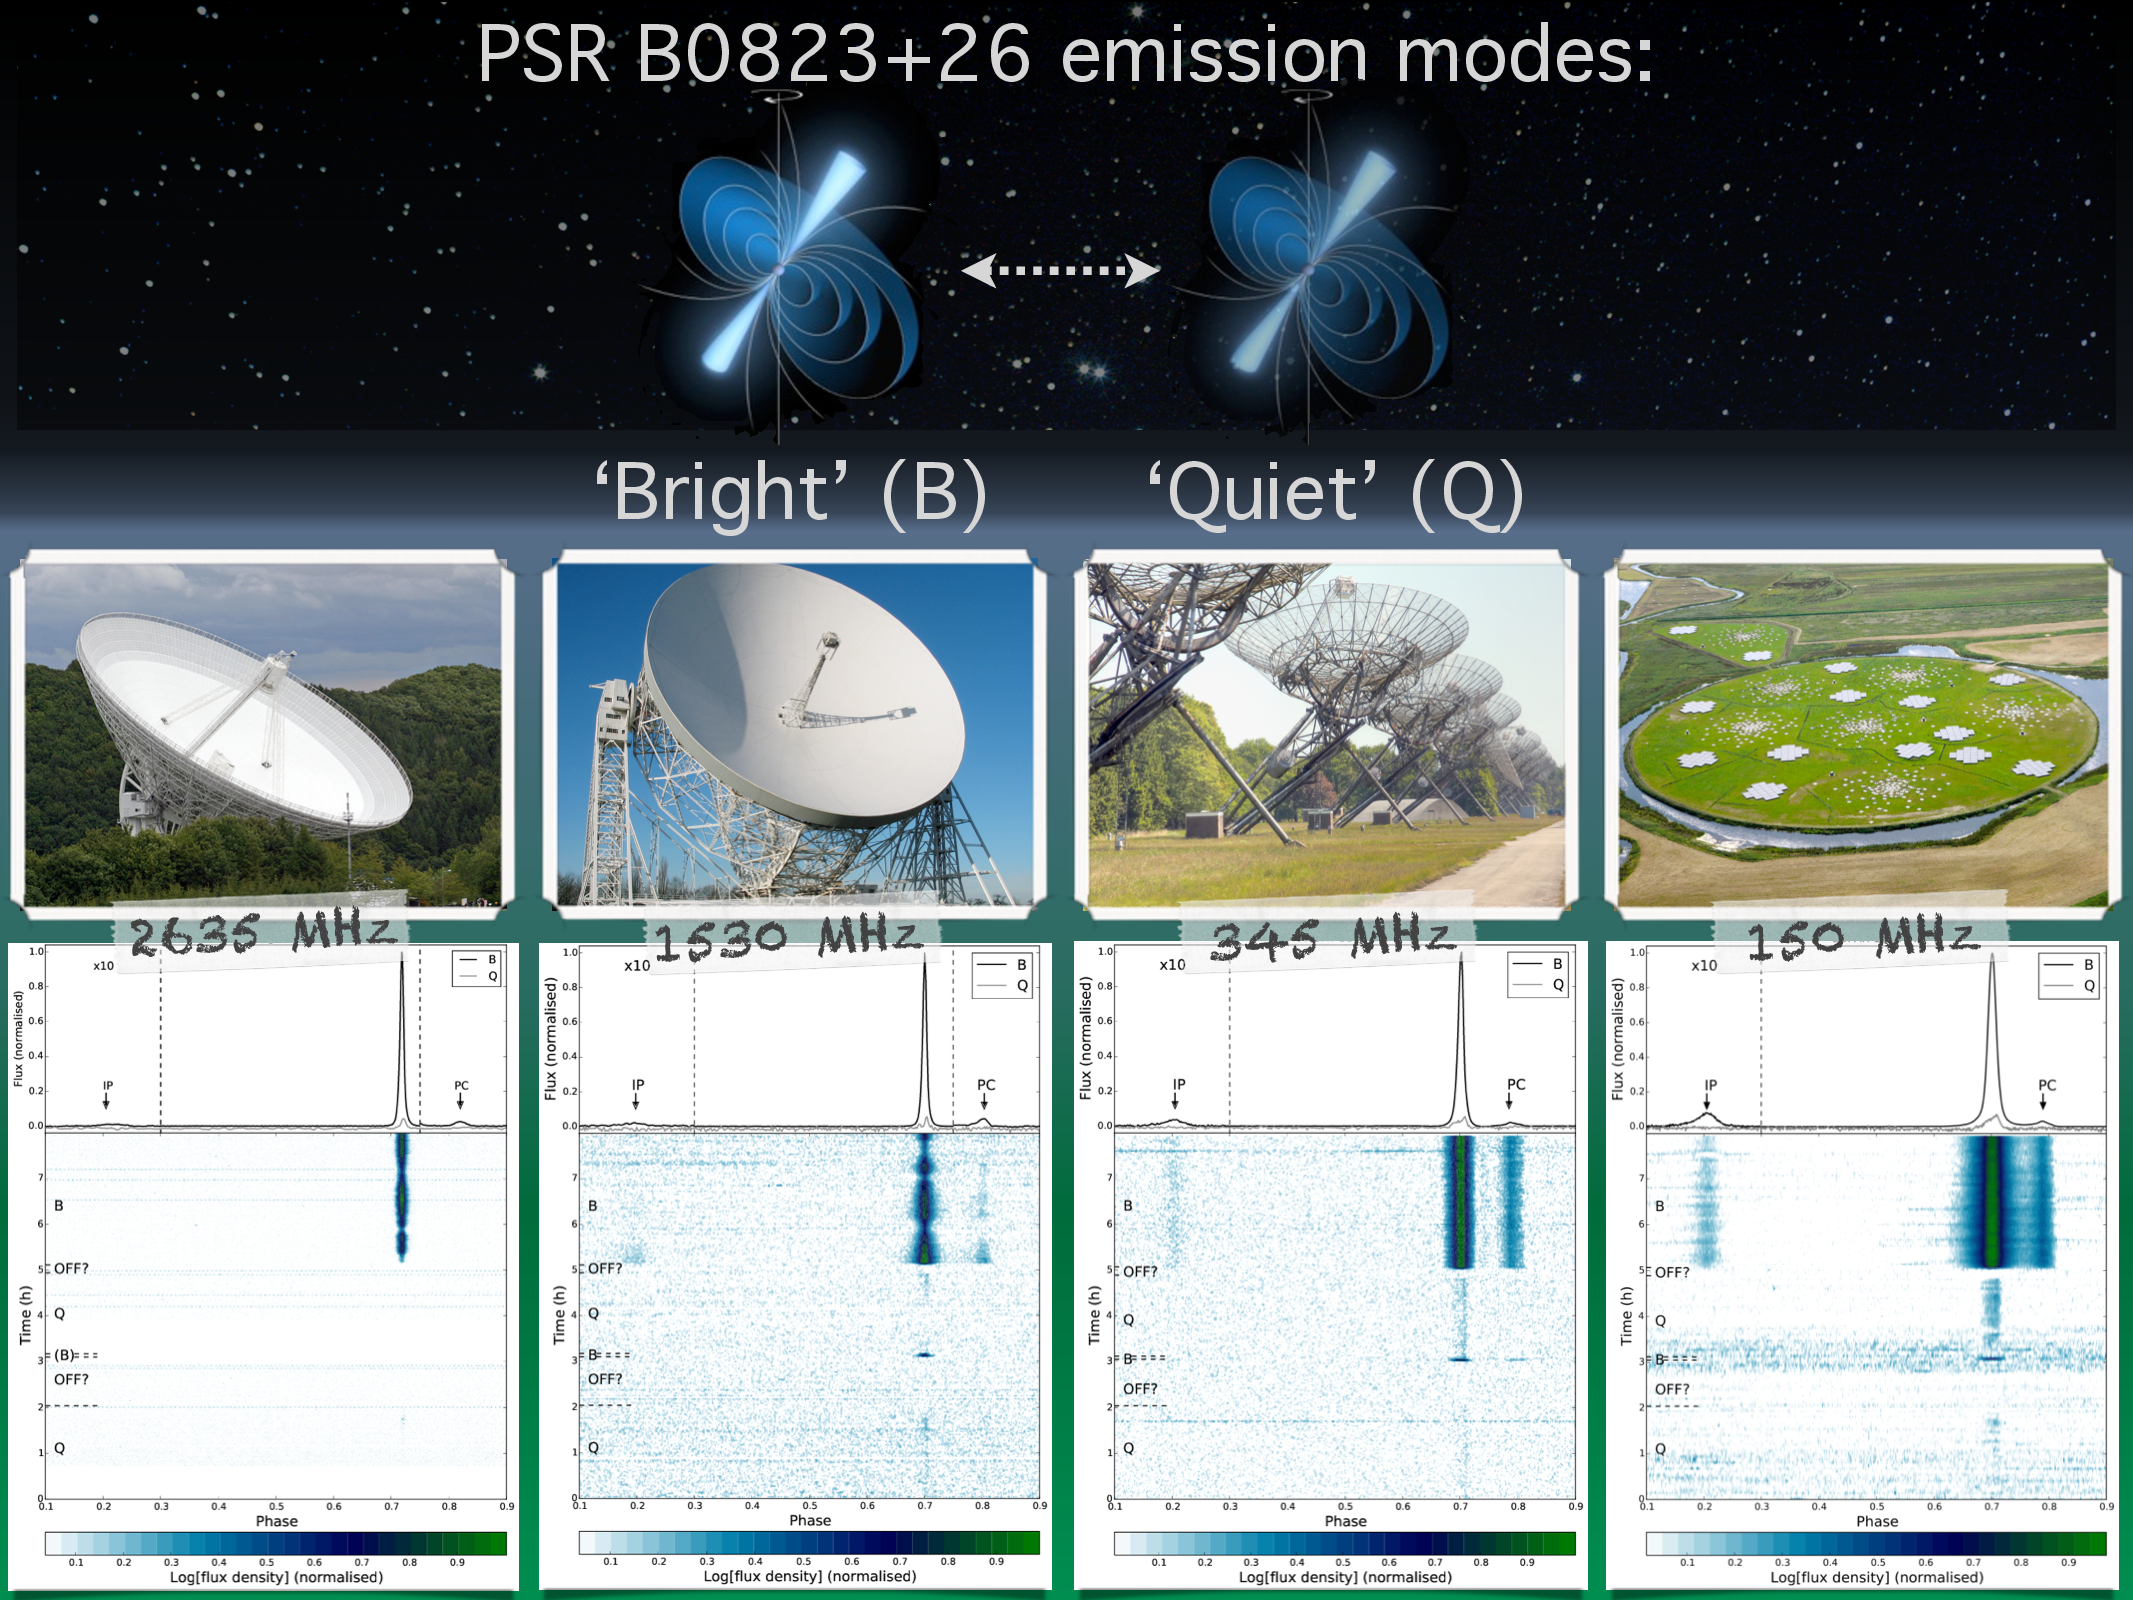
LOFAR discovery of a quiet emission mode in PSR B0823+26
| Submitter: | Charlotte Sobey |
| Description: | The average pulse profile shapes of radio pulsars are remarkably stable when summed over at least a few hundred rotations. Nonetheless, pulsar emission variability has been recognised on almost all timescales that are observationally accessible: from nano-seconds to decades. PSR B0823+26, a 0.53-s radio pulsar, displays a host of emission phenomena, including: subpulse drifting, nulling, and mode-changing (an abrupt switch in the pulsed emission between two or more well-defined pulse profile morphologies). Studying pulsars that display many of these emission characteristics, such as PSR B0823+26 (and PSR B0943+10, another interesting mode changing pulsar, see here and here for previous daily images), provides further insights into the behaviour of the radio emission from the pulsar magnetosphere and the relationship between the various emission phenomena. In a paper recently accepted by MNRAS, Sobey et al. 2015, we report on the discovery that PSR B0823+26 has a weak and sporadically emitting 'quiet' (Q) emission mode (using observations from LOFAR), that is over 100 times weaker (on average) and has a nulling fraction forty-times greater than that of the more regularly-emitting 'bright' (B) mode. Simultaneous eight-hour observations taken using the LOFAR, Westerbork, Lovell, and Effelsberg telescopes (pictured from right to left above) between 110 MHz and 2.7 GHz are shown here. The lower plots in the image above show the flux density of the pulsar against pulse phase and integration time. The modes of emission identified (Q-, B-, and, tentatively, `OFF?') are labelled, and are delimited by the dashed lines. Modulation of the B-mode brightness due to scintillation is visible in the higher frequency Lovell and Effelsberg data. The plots above these show the time- and frequency-averaged pulse profiles separated into Q-mode (grey lines; 10x magnified) and B-mode (black lines). The B-mode postcursor (PC) and interpulse (IP) pulse profile components are also indicated by the arrows. These observations show that the transition between the Q-mode and B-mode is concurrent across the range of frequencies observed. |
| Copyright: | CS & LOFAR PWG; pulsar illustration credit: ESA/ATG medialab; Effelsberg photo credit: Jürgen Wohlfahrt; Lovell photo credit: Ian Morison; WSRT photo credit: Raimond Spekking; LOFAR image credit: Aerophoto Eelde |
| Tweet |  |