Daily Image
14-02-2017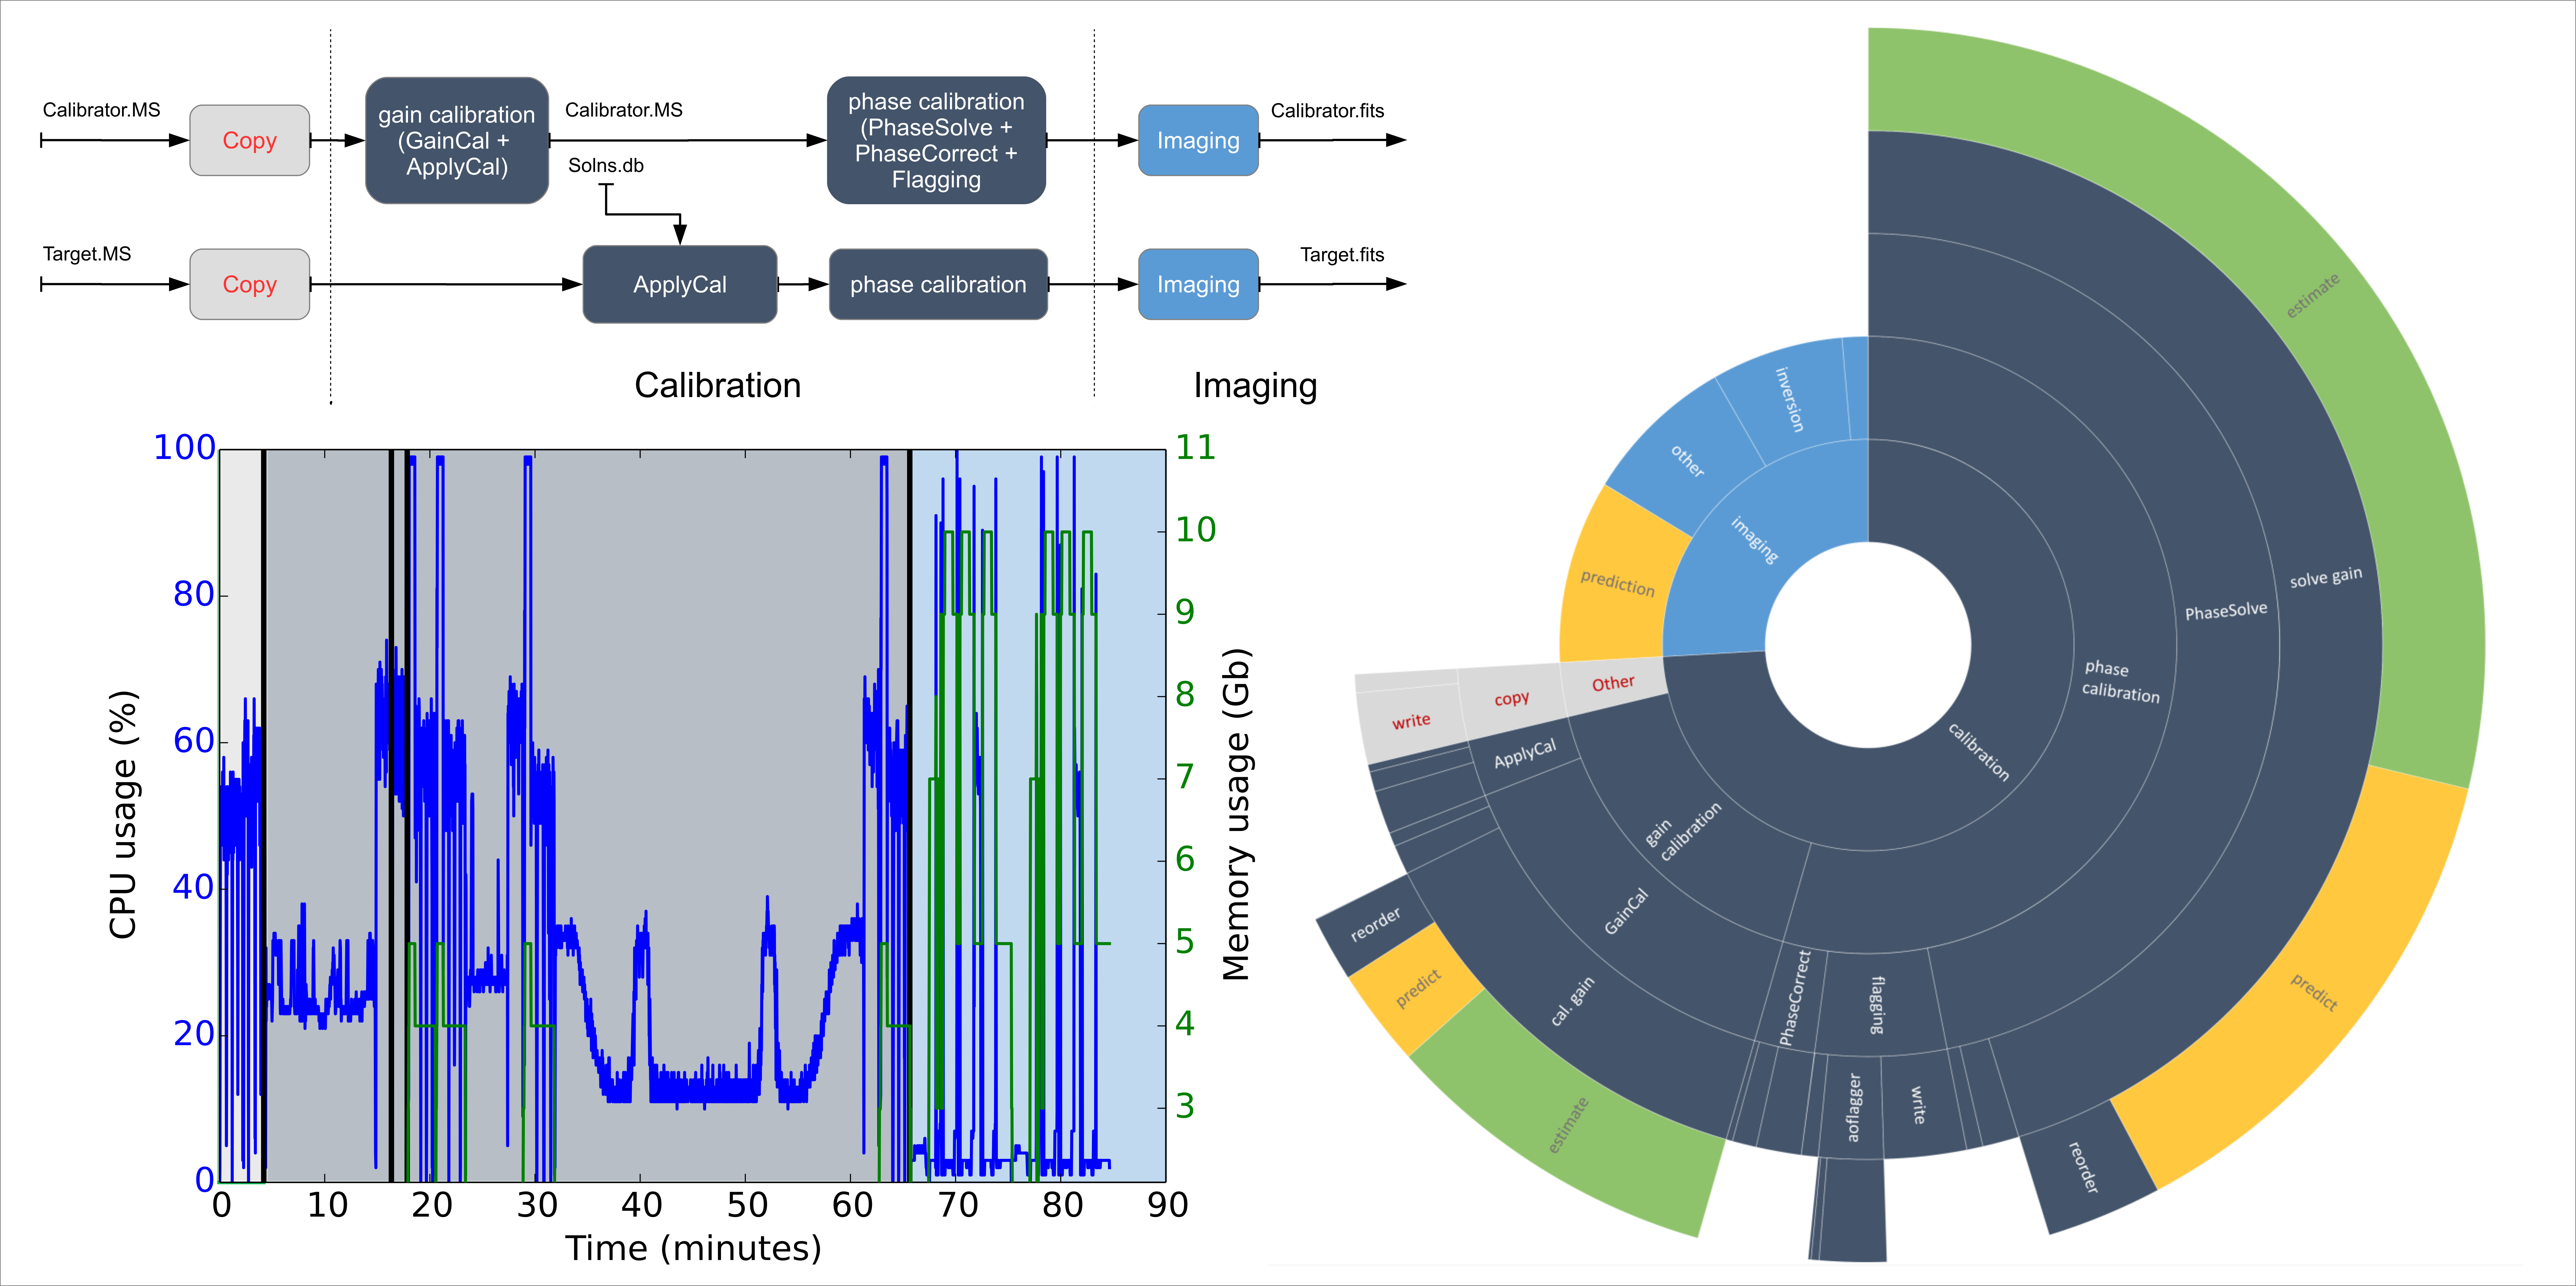
Characterising pipeline workloads
| Submitter: | Yan Grange |
| Description: | The image shows a possible analysis of the resource usage by pipelines. Understanding how pipelines affect the underlying hardware in a uniform way can for example be used to measure improvement of new pipelines or efficiently do observation scheduling. The top-left image is a graphical representation of the pipeline we used (kindly provided by Marco Iacobelli). Underneath, a plot shows the usage of CPU and memory. The image of the right shows how much time is spent in each part of the pipeline in a hierarchical way. The work has been presented at the Astronomical Data Analysis Software and Systems (ADASS) conference. A PDF version of the poster can be found on the website of the conference. The presented results, which will also appear in the conference proceedings, can be found on arXiv. |
| Copyright: | R&D Compute group |
| Tweet |  |