Daily Image
17-06-2022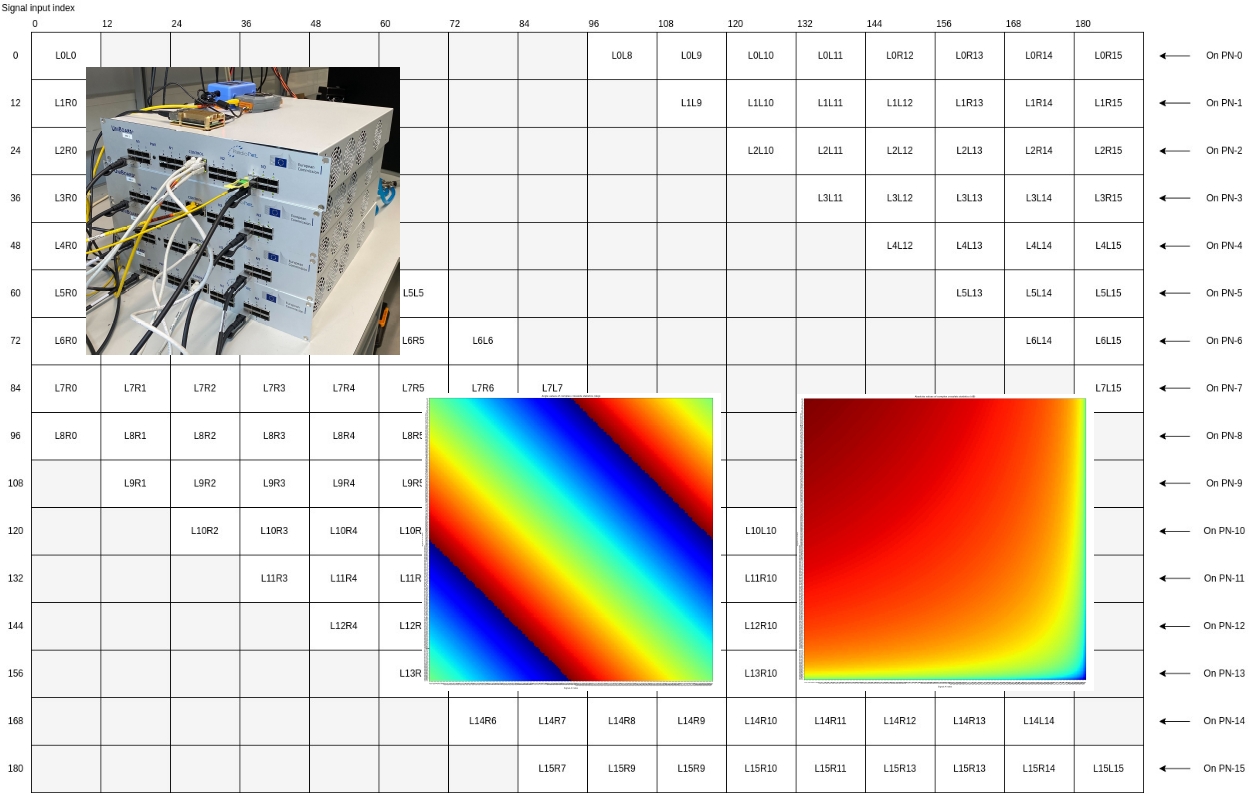
Full subband correlator test for a LOFAR2 Station
| Submitter: | Eric Kooistra |
| Description: | The subband correlator in a LOFAR2 Station will cross correlate subband data between 192 antenna signal inputs (all LBA or all HBA), to measure the array correlation matrix (ACM) for 192x192 signal inputs. For this we need 4 UniBoard2 FPGA boards with in total 16 FPGAs. The LOFAR2 project so far only has two UniBoard2s. Fortunately, we were kindly allowed to use the four UniBoard2s that were used in ARTS, as shown in the photo. The drawing in the background shows how the subband correlator calculates the array correlation matrix (ACM) for 192x192 signal inputs. The subband correlator on each FPGA calculates the 144 cross correlations between all pairs of 12 signal inputs, shown as 12x12 sub squares. On the diagonal there are the auto correlations. The empty sub squares are not calculated, but we can fill them in, because they are the complex conjugate of a corresponding sub square on the other side of the diagonal. The cross correlation results between signal inputs are called visibilities. Hence in total the subband correlator calculates 192 * (192+1) / 2 = 18528 unique visibilities per subband. In a test we set up the 192 signal inputs with a sinus test signal, such that the signal inputs have a slightly decreasing amplitude and a phase difference of 360 / 192 ~= 1.9 degrees. The two ACM plots in the picture show that the phase differences of the visibilities vary from 0 to 360 degrees and that the powers of the visibilities gradually fade from high to low. There is still more integration test work to do, but this is a great result, because it shows that the final system should be able to handle the 192 signal inputs. Without the four UniBoard2’s from ARTS we would not have been able to verify this already now. |
| Copyright: | ASTRON |
| Tweet |  |