Daily Image
04-11-2009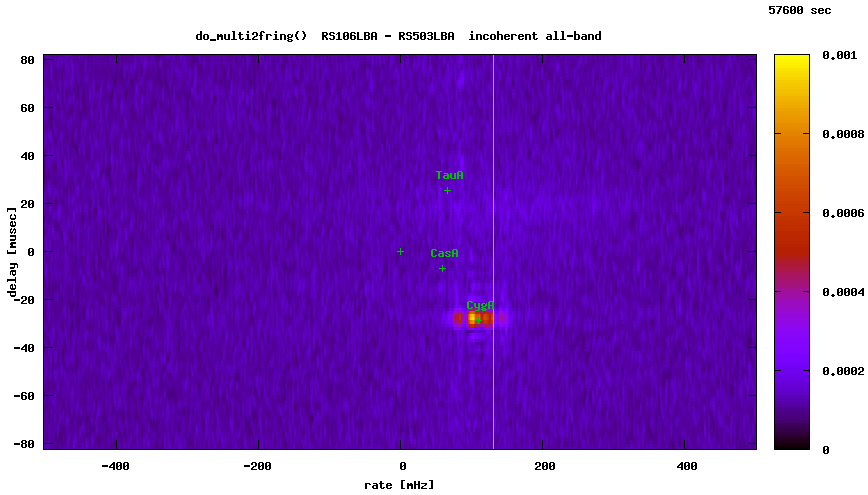
Full-sky imaging with a single LOFAR baseline
| Submitter: | Olaf Wucknitz |
| Description: | The movie shows delay vs fringe rate plots for LOFAR LBA observations of the source 3C48 for a single 10 km baseline. See the daily image of 2nd October 2009 for additional explanations. The target source 3C48 shows up as an intermittent faint blob near the phase centre (0,0). The thin blue line indicates the fringe rate that has been applied by the correlator to put 3C48 there. Rather more interesting is the fact that Cygnus A is a much more prominent feature, even though this source is as much as 65 degrees away from the phase centre. (Cas A, which is even brighter, and much closer to the phase center, is resolved for this baseline length and frequency.) The explanation is that the signal of the bright "A-team" sources (Cygnus A, Cas A, Taurus A, Virgo A) leaks in through the high-order sidelobes of the station beam. Note that their position in the plot changes as its fringe rate and delay change with the change in orientation of the baseline w.r.t. the sky, due to Earth rotation. The sources are spread out horizontally because their fringe rate depends on frequency. As Cygnus A moves through the far sidelobe pattern of the LOFAR station beam due to the apparent rotation of the sky around the position of the pointing center (3C48), the source also appears to move horizontally, because different frequencies appear stronger at different times. Clearly, this is a highly instructive plot, especially in the context of LOFAR calibration. For instance, the frequency behaviour of Cygnus A does not bode well for the smoothness of the station beam in the frequency dimension. An alternative movie where delay and rate are mapped to their corresponding sky positions will be shown as daily image in the near future. |
| Copyright: | public domain |
| Tweet |  |