The last two months we have celebrated many successes: The first prototype subrack is flashing in the lab, the LOFAR4SW project reached the Critical Design Review (CDR), and the first dynamic spectrum with the new LBA RCU was observed, using software delivered by the Station Control team. Well done!
In the background, preparations for two new activities have started. First, we are defining a project to develop a drop-in replacement of the HBA-FE board. The replacement is needed because we will no longer be able to produce this board soon. Second, we are working on a plan to connect the NenuFAR antennas at Nançay to the French LOFAR station (FR606) to boost the sensitivity of the LBA array. A test observation in August successfully demonstrated the improved sensitivity in both imaging and beamformed modes. A proposal for a structural implementation will be discussed by the ILT Board in December.
Happy reading!
Science
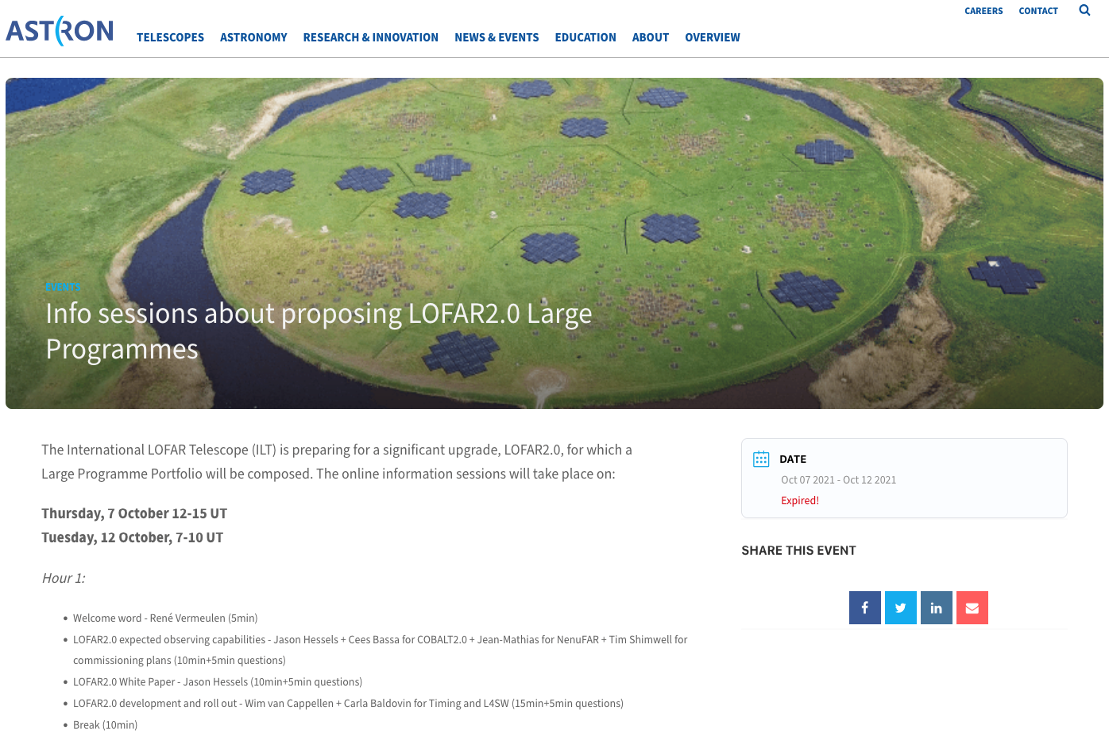
On October 7th and 12th, 2021, we held information sessions to update the scientific community about the various upgrades that are part of LOFAR2.0, as well as the progress of the development to date. We enjoyed exciting presentations about the first prototype LOFAR2.0 electronics, new analysis software and COBALT2.0 functionality, and the state of the art in terms of LBA and long-baseline imaging. At the same time, we opened a call for expressions of interest (EoIs; deadline December 3rd, 2021) that will lead eventually to LOFAR2.0 Large Programme proposals in 2022. See here for the EoI template and further information: https://www.astron.nl/events/lofar2programmes/
It was great to see about 140 people at the two sessions, combined, but we can appreciate that some of you may not have been able to attend or would like to rewatch and peruse the slides. The full set of presentations and slides is now also available via the aforementioned website.
Systems engineering
Multiple perspectives on a single system
How to describe the LOFAR system to a variety of stakeholders? Everybody looks at the system from a different perspective, and each perspective is interesting and valuable. So how do we keep the different views consistent with each other? If not, we may end up in chaos.
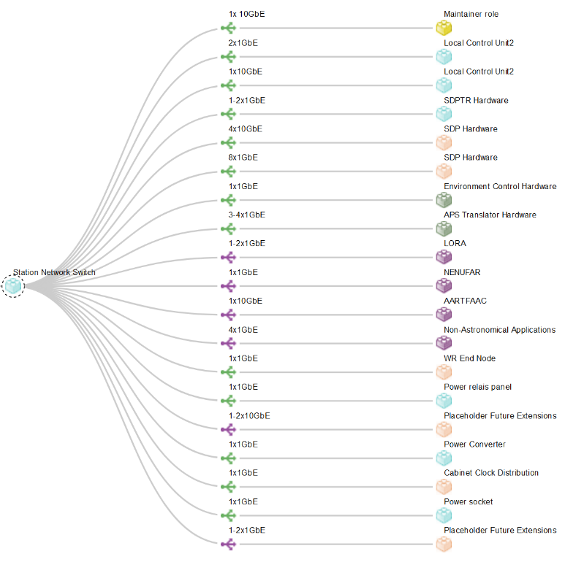
The figures just give an example of two different perspectives on the same sub-system.
- The first figure shows the perspective of the network in the station. On the left, there is the Station Network Switch. Through interfaces it is linked to other products that have a network connection. The figure comes in handy in discussing the requirements of a new network switch.
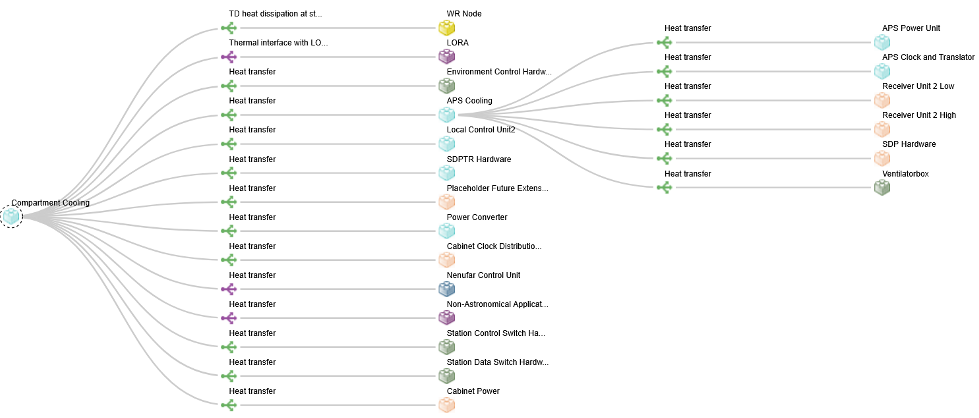
- The same system seen from the perspective of heat transfer, is different (second figure). Now the Compartment Cooling is linked through Heat-transfer interfaces to a set of products that produce heat. The Antenna Processing Subrack (APS) has its own cooling system, which is used to transfer the heat produced inside the APS to the Compartment. Each interface has a specification, indicating the amount of heat transfer (not shown). This figure and the information it represents is useful in sharing ideas on the cooling system.
In the LOFAR program, we solve this by using a single basis for both figures. The different viewpoints relate to each other through the products. Modelling that with a single set of products, consistency is ensured and completeness checks can be done. Over time we can even add other perspectives, like the logical breakdown or the integration structure. Each time we expand the system model, we add a valuable perspective to it. That helps us in sharing ideas on improving the complex system of LOFAR in an understandable manner.
Station
We have just received the first version of the last board we set out for production, the LMP or LOFAR Midplane. This board connects all other boards in a subrack and is crucial for its functioning. It handles power distribution, clock distribution, digital signal transfer between the RCU2s and the Uniboards, control and monitoring data. And it serves as EMC shielding between the RCU2s on one side, and the other boards on the other side. The production of this board suffered from a long COVID lockdown in Vietnam, which necessitated the production of an intermediate midplane board, called the PCLMP, with limited functionality and shielding compared to the final board. Now that we have received the first LMP, we can start to integrate all boards in a final subrack for DTS, the test cabinet in the ASTRON backyard.
While doing this, the existing DTS subrack with the PCLMP board will be used continuously, amongst other items for temperature tests in the ASTRON climate room. This room can be heated up to 50 degrees Celsius, which is close to the required maximum temperature of the LOFAR2.0 subrack cabinets. We will verify that the subrack can continue to operate and that its components can be cooled sufficiently even at this extreme ambient temperature.
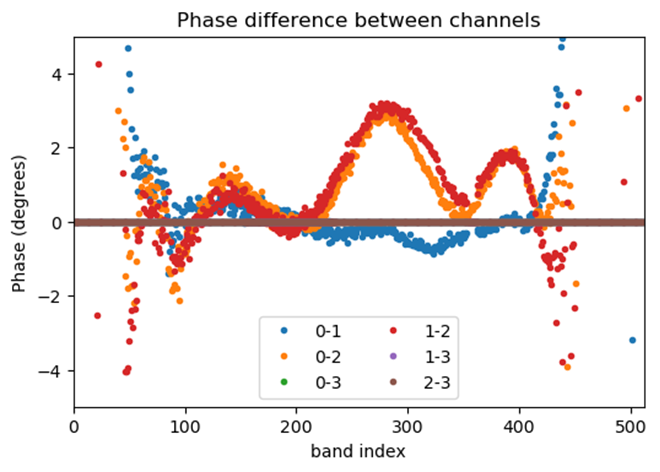
Thanks to ongoing software and firmware development we have been able to run a 24-hour test of the RCU2-Ls and record the subband statistics in the LBA band with a single LBA during this period. The test went smoothly, but only after significant RFI sources in and near the ASTRON building had been identified and switched off. The test has learned us that the RCU2L design is indeed fulfilling the requirements in terms of noise and bandpass behavior. More tests will follow when we have the final DTS subrack and can connect all nine LBA antenna that are available in the test field.
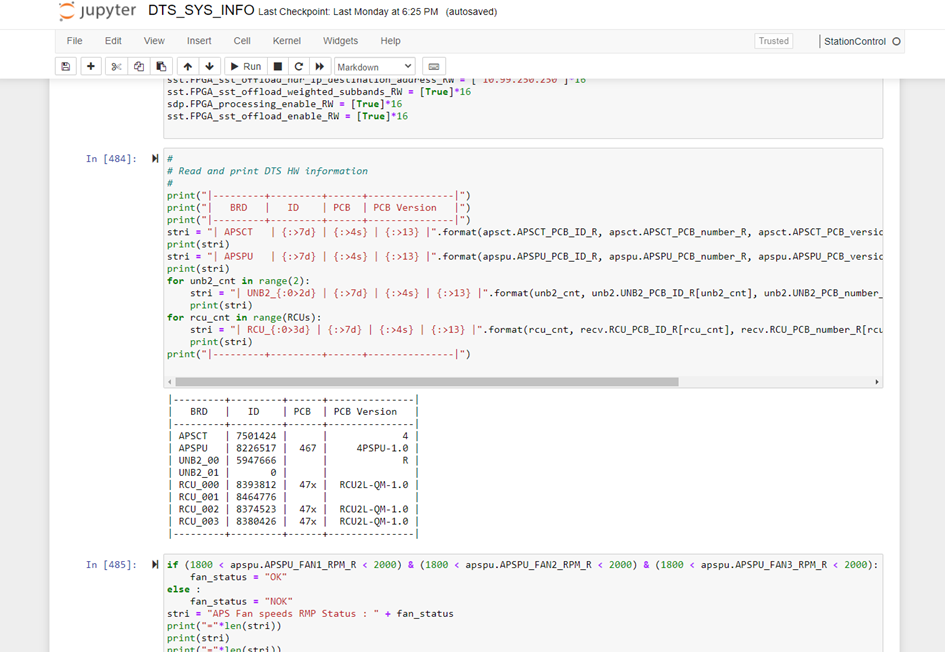
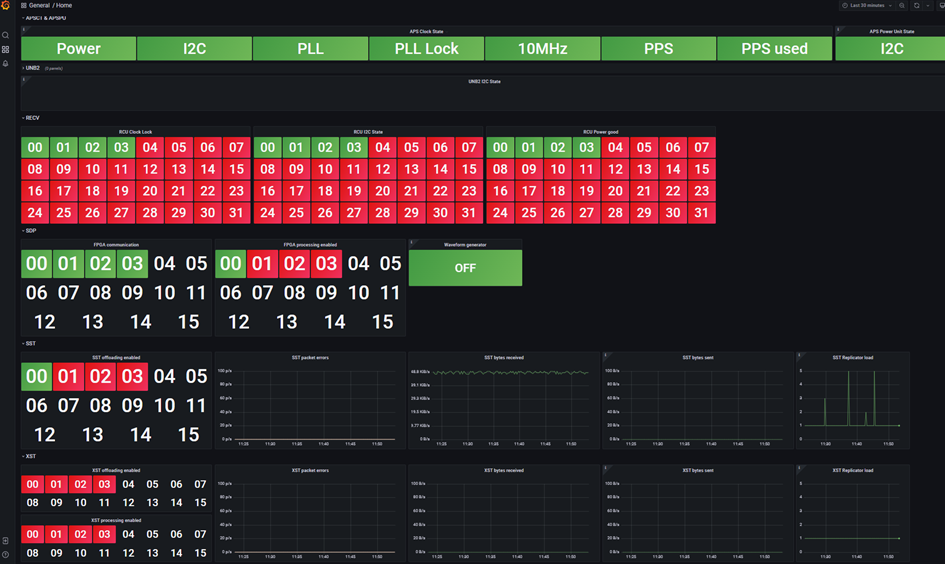
The Jupyter notebooks and Grafana dashboard that have been set up have been extremely useful for the testing and debugging of the subrack boards. The notebooks provide a user-friendly and highly automated environment to run tests and store test methods and test results consistently. This feat is possible only through the effort that the software team has put into setting up a Tango framework that connects the notebooks with the system translators, which in their turn communicate with the hardware. It is exemplary for the level of integration that has already been achieved at this phase of the project.
Last of all: to keep track of events happening in this project, please follow our news blog posts in Confluence, either through this link: https://support.astron.nl/confluence/display/L2M/DTS+NEWS or by joining the #lofar2-general Slack channel in the ASTRON slack workspace. Non-ASTRON readers may have to request permission to access our news blog.
Timing Distributor
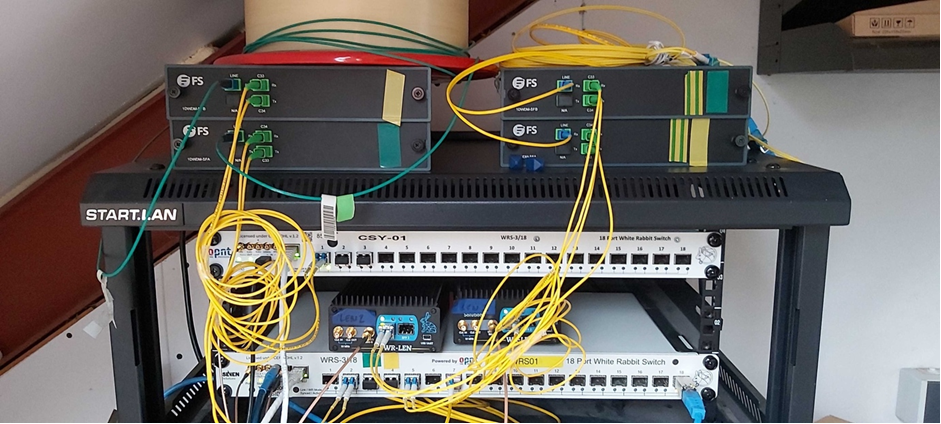
After passing the CDR in August, the team has been working on the next step in the project. The plan is to use RS208 as a Pilot station for TD. This will be the first station to have a White Rabbit link installed and will receive the clock from the Concentrator node. RS208 has been chosen because it has one of the longest timing links. This link will be monitored from the Concentrator Node. To check the stability, an 8-hour observation will be done first. After the test observation the station will continue to receive the clock from the Concentrator node until the time of the rollout of TD in the remote stations, when the hardware will be replaced by brand new equipment.
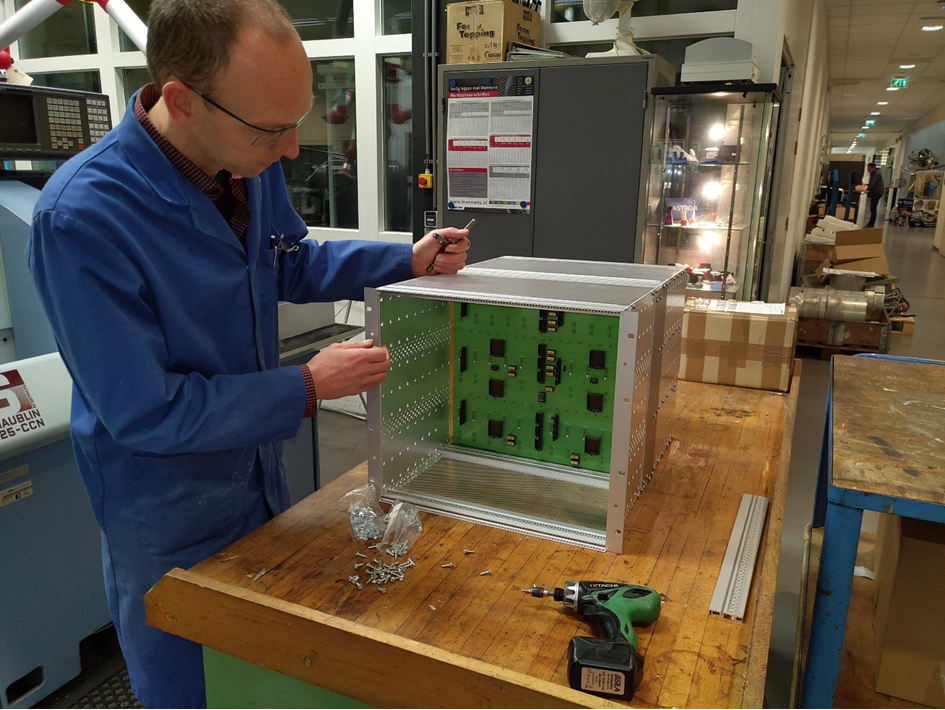
The picture shows the setup used to calibrate the equipment before installation in LOFAR.
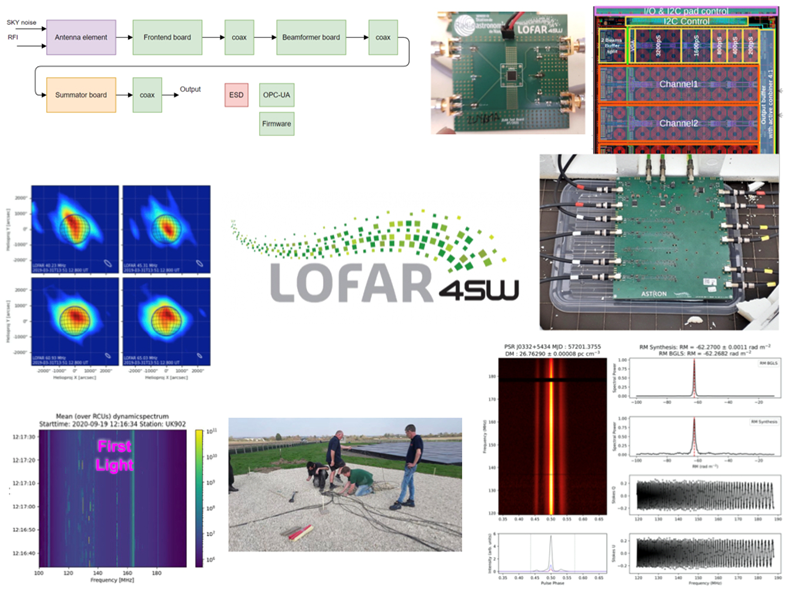
LOFAR4SW
LOFAR4SW CDR: Another important milestone achieved!
The LOFAR4SW team has been working hard over the last couple of years to deliver a design of an upgrade to LOFAR to become a space weather monitoring instrument in the future, that could work in parallel to regular astronomy observations. You can image the complexity of this task. The design encompasses science use cases, an upgrade to the HBA (only electronics, no mechanical parts have been considered), monitoring and control software, pipelines, operations model and governance aspects. The image gives only a small impression of what this design is about.
The major milestone in the project is the critical design review, held on September 21-23. The design was put under the scrutiny of a panel of experts from different domains and expertise formed by:
Tim Bastian (chair – NRAO)
Iver Cairns (University of Sydney)
André Csillaghy (University of Applied Sciences Northwestern Switzerland)
Boudewijn Hut (ASTRON)
David Jackson (UK MetOffice)
Menno Norden (ASTRON)
Federico Perini (INAF)
The most challenging aspect was that it included people at very distant locations, giving only a reduced timeframe each day for discussions. Luckily it turned out to work very efficiently. During the three days the team presented the different parts of the design and had constructive and insightful discussions with the reviewers. The review panel delivered a thorough report with very clear recommendations to continue maturing the design.
Other activities in this period include a Stakeholder’s workshop (October 14), where the team presented the design and discussed possibilities for the future together with members of the ILT board, ASTRON MT, and Solar and space weather KSP. On October 27, the project hosted a demonstration session at European space weather week to also present the design to the broader sw community. More activities are planned in the coming months, including a final consortium meeting before the end of the project in February 2022.
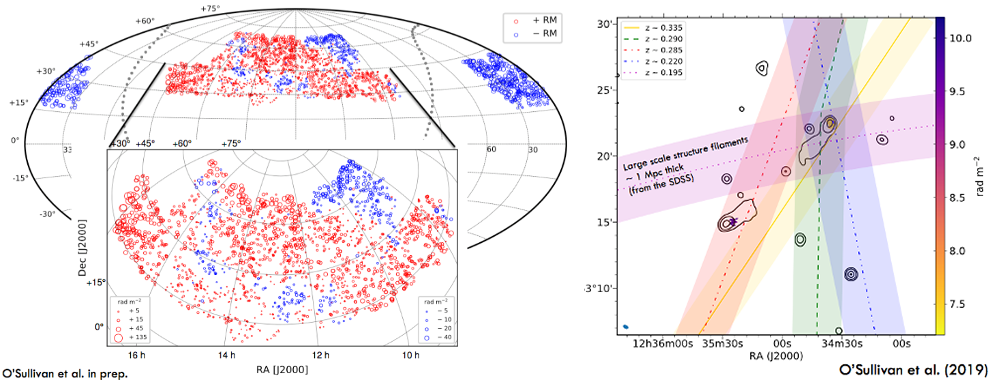
LOFAR RM Grid capabilities
Of the 4.4 million radio sources that LoTSS has detected so far, only 0.06% of them have been detected in polarization, mainly because of the effect of Faraday depolarization (due to fluctuations in the magnetic field on scales smaller than the synthesised beam). However, the 2,461 extragalactic sources that have been detected are incredibly valuable due to the unrivalled precision in the RM measurements. This is allowing us to probe weak magnetic field strengths in filaments of the cosmic web that are out of reach for most telescopes (Fig.1). LOFAR2.0 advances will enable us to more routinely generate images at 0.3”, where depolarization effects should be substantially reduced, which may have a revolutionary effect on the number of polarized sources we can detect (here’s hoping!). In the meantime, watch out for the publication of exciting new results from LOFAR cosmic magnetism studies in the coming months!
Warning: Undefined array key "show_parent_page_in_sidebar" in /srv/www/wordpress/wp-content/plugins/oxygen/component-framework/components/classes/code-block.class.php(133) : eval()'d code on line 10
SEE ALSO: